Put It in Park
This was a semester long project completed for CS373 - Software Engineering with Glenn Downing for the 2019 Fall semester at the University of Texas at Austin. I completed the project with Ella Robertson and three other team members who I won’t name here.
Below is a long Technical Report that covers everything we needed to document for the final project. But what it doesn’t mention is the process that it took to bring PutItInPark back online after nearly 4 years dormant.
Because our database and our backend were hosted on Google Cloud Platform, we were constrained by the meager amount of student Cloud credits we got. And while we had enough to get us through the school year, after the class had finished and the next year started my account slowly drained to 0.
However, I was extemely proud of this project! I started drafting this write up multiple times during the lockdowns of 2020, but could find no simple way of bringing the site back online without spending a few hundred dollars a year. However, I knew it was possible because the site had nothing dynamic, no user data, and zero updates since the class ended.
In 2024, I finally got the motivation to attempt the conversion. This included
- Switching from the traditional React Router to a
HashRouter. You may notice that every url has a#(e.g.PutItInPark/#/states/1). This pattern allows us to have a single page app that acts like we have a bunch of distinct pages. - Created new python scripts to fetch data and store it in javascript objects (
client/src/fake_api/). These files act as our ‘database’ which is fine because we only update them manually by rerunning the scripts, and there’s no user data in there. - Creating a
fakeFetchApi method inclient/src/fake_api/fakeApi.js. Here we accept an ‘api string’ and parse it the same way our Flask API used to. This includes handling pagination, filtering, sorting, and more! It was an interesting exploration to implement these features manually, as before I just completely relied on Flask. - Created a new home page visualization that was more interesting than a stock photo.
- A bunch of other small quality of life updates that once I started it was hard to stop! 2019 me really had some bad practices around React components.
Even with all of this there is likely some lingering bugs! Please feel free to poke around the website and email me any feedback.
CS373 Reflections
This was one of the most intense computer science electives I took at UT. The semester-long project was just one component in the course. Most of the class time was spent learning basic python and basic SQL, and we were left to figure out the technical side of the project ourselves. We also had to write weekly blog posts dicussing our lives and answering given prompts.
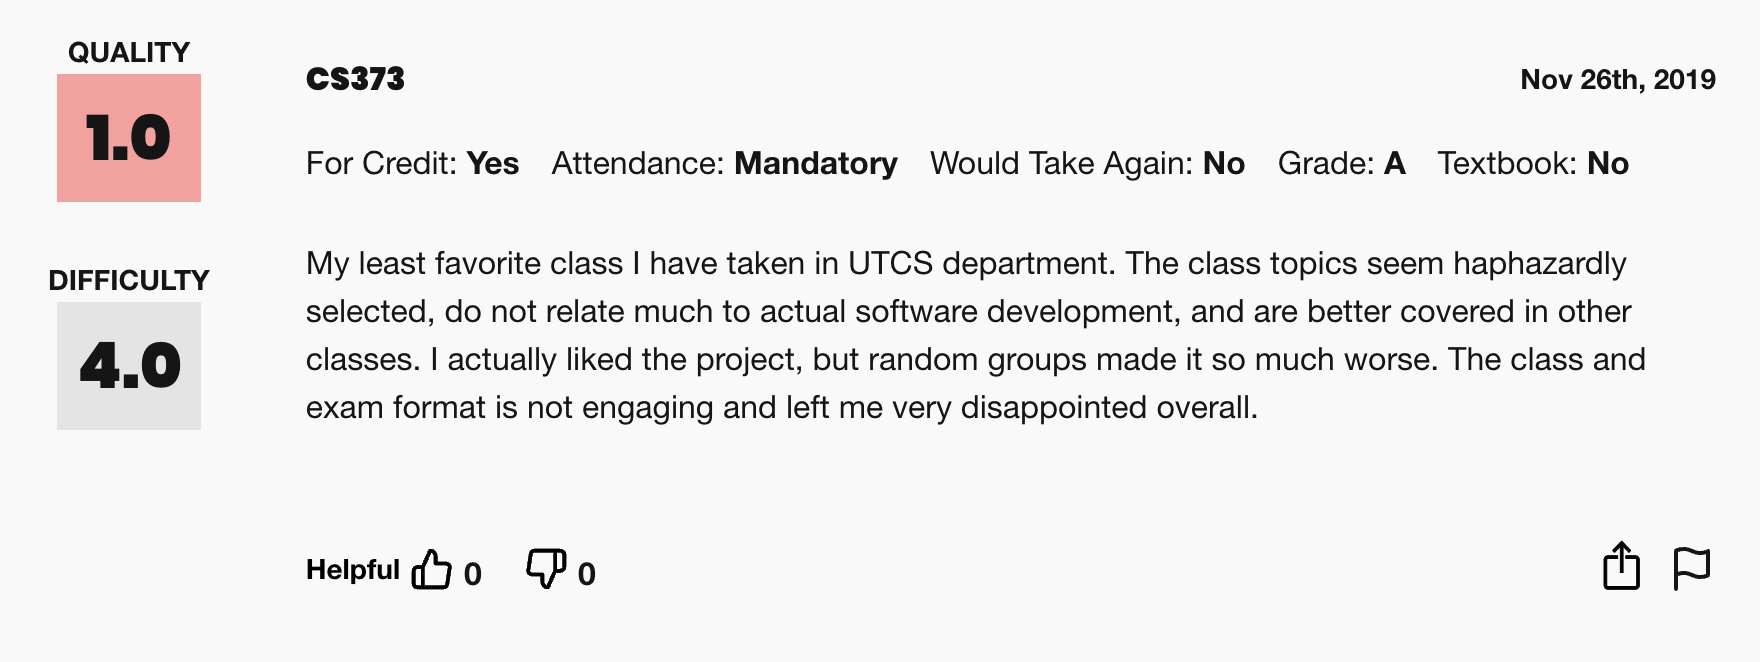
My RateMyProfessor Review after the class was finished
My least favorite class I have taken in UTCS department. The class topics seem haphazardly selected, do not relate much to actual software development, and are better covered in other classes. I actually liked the project, but random groups made it so much worse. The class and exam format is not engaging and left me very disappointed overall.
This class had incredible potential, and it was the CS elective I was most excited about UT. The concepts that were explored and the premise of the group project really excited me as a web developer and designer. However, the in person content was essentially Python 101 for the first two months, and then intro to SQL for the rest of the class. The project, on the other hand, involved creating APIs, databases, and a React frontend. These were engaging topics! But none of them were covered in class.
Team member choice was also entirely out of my control. We filled out surveys at the beginning of the semester with our availability, demographics, etc, and were sorted into groups of algorthmically generated compatibility. In my case, I was partnered with 4 teammates. Three of them contributed less than nothing to the final project. For one reason or another (last semester of college with a job already lined up, mental health crisis, other university priorities), these teammates were focused on anything but this class, and would lie about progress until right before the deadline. And the professor, in his infinite wisdom, gave one grade to the whole group with no recourse of changing teams, or negotiating higher grades for more work.
I still vividly remember the day our first project milestone was due. I was in Chicago for 2 days only for an Optiver intervew. I was walking around the city for the first time - I saw The Bean, checked into my hotel (The Athletic), and walked along the lake shore. I had finished my work days earlier, telling my teammates that I would be offline while in the Windy City. While walking around Millenium Park, I sent a message to a member of the team whose work had not yet been added. He was in charge of creating a frontend page for each of our three data models, and had told us days before that he was all but finished. This page did not yet have to be hooked up to real data, just a blank canvas for which to start the frontend.
I watched my message be ignored for one, two, three hours. I sent a few more follow-ups, each more desperate as the midnight deadline got closer and closer. Eventually, I had no recourse but to send a message I was going back to my hotel and doing it myself, with still nothing but complete radio silence from my teammate. Finishing the hasty web page in a few hours, I committed the code and sent it to the team, leaving to get a slice of deep dish pizza at one of the few places still open that late. Immediately following a half day of silence, my teammate replies that he was offended I had done his work, and that he had just finished the code himself. I hastily apologized, and asked him to commit his code that he had worked the past two weeks on, and we could just discard my attempt. However, he said that oh no! He had actually just deleted it, and we could just use my work for this milestone.
This was unfortunately not a one time occurrance. The project was plagued by broken promises, missed deadlines, and non-functioning code. After this hapened twice, my teammate Ella and I started splitting work meant for 5 among just the 2 of us, assigning our other 3 team member to smaller, inconsequential aspects of the project which they also struggled to finish on time.
This all being said, I became intimitely familiar with this project. I set up the Google Cloud project, I created the entirety of our API, I wrote the entirety of our backend, I designed and developed every single page of the website, and created every data visualtion. And Ella setup the entire database, got API keys for all of our data sources, and created all of the schemas used for the backend. She truly was the one saving grace of this ill-fated team, and I fear I would have gone insane without her.
When it came time for the final presentation, we knew we had hit it out of the park. Our website was the most full-featured and best designed of the class. We had a predictible color palette, slick layouts, and even a responsive mobile site! Just the fact that we bothered to add proper spacing and legible text made us stand out amongst the hoard of functional-but-plain websites. We were added to the shortlist of example websites for future CS373 students to study, and received a hearty round of applause from our classmates.
Did all that make the suffering worth it?
No ? Maybe. But I still like the site :)
Motivation
This project aims to encourage Americans and tourists to go outdoors by highlighting National Parks and recreational activities in their area. This would serve to promote physical fitness and increase awareness of all that national parks have to offer. In doing this, we hope to answer three questions:
- What national parks are in close proximity to our users?
- What recreational areas are in close proximity to our users?
- What types of sites can visitors expect to see in each area and what activities can they participate in?
For this class, we also had to complete User Stories, Hosting, etc but with most of these links down now, they don’t make much sense anymore. However absolutely everything is linked in the full Technical Report.
Restful API
APIs currently utilized:
- National Park Service (NPS) API - Used to pull information about national parks.
- GitLab API - Used to pull members’ profile pictures, amount of commits, and amount of issues.
- Recreation Information Database (RIDB) API - Used to pull information about recreational activities.
- U.S Census – 2018 Population API - Used to pull information about population for all U.S States
- Bing – Bing Image Search API – Used to find photos for recreational areas.
Our API (PINP API):
How to construct a query using Flask Restless
• Requests of models return a list of all parks/recreation/states depending on the URL specified in the request
• Requests of instances return specified park/recreation/state given respective id’s as a parameter.
• Requests of models specifying a park/recreation/state id return a list of instances of that model that offer or exist in that park/recreation/state.
Models
National Parks
The model “National Parks” represents the 49 parks throughout the contiguous United States. This model connects to the “States” model as location plays a large part in park visitation, and it connects to the “Recreational Activities” model as National Parks often include outdoor recreation.
Examples of filtered/sorted attributes
- Park Code
- Park Name
- Location
- Number of related recreational areas (if any)
- Fees
- Annual visitors
Examples of searchable attributes
- Park Code
- Park Name
- Location
- Related Recreational Area IDs
- Description of Park
- Park-ID
- Weather Info
Recreational Activities
The model “Recreational Activities” represents the estimated 500+ recreational activity opportunities throughout the United States. This model connects to the “States” model as different recreational activities are available based upon location, and it connects to the “National Parks” model as National Parks often include outdoor recreation.
Examples of filtered/sorted attributes
- Recreational area ID
- Reservable
- Number of activities
- Parent org ID
- Stay limit
Examples of searchable attributes
- Recreational area name
- Location
- Related National Park (if any)
- Activities
- Description
Locations
The model “Locations” represents the states within the United States, plus Washington D.C. This model connects to the “Recreational Activities” model as different recreational activities are available based upon location, and it connects to the “National Parks” model as National Parks are visited heavily based upon their location and are tied to the ecosystem of the land they exist on.
Examples of filtered/sorted attributes
- FIPS code
- State name
- Mail code
- Number of national parks (if any)
- Number of rec activities (if any)
- Population
Examples of searchable attributes
- FIPS code
- State name
- Mail code
- Names of national Parks (if any)
- Recreational area IDs
Tools
React JS - JavaScript library, namely using react routing
- Node - JavaScript run-time environment that executes JavaScript code outside of a browser
- Express - Web application framework for Node.js, designed for building web applications and APIs
- Google Cloud Platform (GCP) - Used to deploy and host the web application
- Bootstrap - free and open-source CSS framework directed at responsive, mobile-first front-end web development
- Postman - Used to document our API and output in HTML format.
- Gitlab - Used to host our code and provide CI/CD environments
- Pixabay - Used to find royalty-free images for the static site
- NameCheap - used to provide website URLs
- Mocha – Used as our JavaScript test framework
- Enzyme – Used to more easily test our React components
- Selenium – Used to automate acceptance tests
- Chrome Webdriver – a controllable webdriver for Selenium
- SCSS – Used to make styles more flexible and readable
- Docker – Used to provide images for frontend and backend development
- Cloud SQL Proxy – Allowed to connect to the database locally using GCP
- Flask – Lightweight python web framework, used for our backend API
- MySQL – Relational database management system used to store our data
- Fuse.js – Used as a fuzzy search to find the closest match to each
- d3.js – Used to create data visualizations for each of our models
API
National Parks
GET leviv.cool/PutItInPark/#/api/nationalparks
Returns all instances of National Parks
GET leviv.cool/PutItInPark/#/api/nationalparks?page=<page_number>&results_per_page=<results_per_page>
Returns instances of National Parks on page
GET leviv.cool/PutItInPark/#/api/nationalparks?q=<JSON_query>
Returns instances of National Parks of which satisfies the JSON query object
Recreational Activities
GET leviv.cool/PutItInPark/#/api/recreations
Returns all instances of recreational activities
GET leviv.cool/PutItInPark/#/api/recreations?page=<page_number>&results_per_page=<results_per_page>
Returns instances of recreational activities on page
GET leviv.cool/PutItInPark/#/api/recreations?q=<JSON_query>
Returns instances of National Parks of which satisfies the JSON query object
Locations (States)
GET leviv.cool/PutItInPark/#/api/location
Returns all instances of locations (US states and D.C.)
GET leviv.cool/PutItInPark/#/api/location?page=<page_number>&results_per_page=<results_per_page>
Returns instances of locations on page
GET leviv.cool/PutItInPark/#/api/location?q=<JSON_query>
Returns instances of locations of which satisfies the JSON query object
Pagination
Frontend support
On the frontend, we used an external library component, react-paginate, in order to facilitate pagination. This component provided a basic HTML pagination element, which we styled to make more accessible and match the theme of our website. With this component, we were also able to define a handlePageClick method, which handled page redirects whenever a pagination element was clicked.
Backend support
On the backend, the API supported calls which accepted a parameter for the number of desired results, and the page number (e.g. 12). This would then return an object containing 12 instances, so that on the frontend, we would only display 12 instances at a time, which was the goal of the paginator.
Database
Data sources
Data was pulled from external APIS including the National Parks API, Recreation Information Database API, Bing Image Search API, and the US Census API. These APIS were called using scripts that can be found within misc/scripts, and information retrieved from them is stored within a MySQL instance on GCP.
Schema
There are three tables, each based on a model: location, nationalparks, and recreation. The schema for each table and the relationship between the tables can best be summarized by the following UML chart:
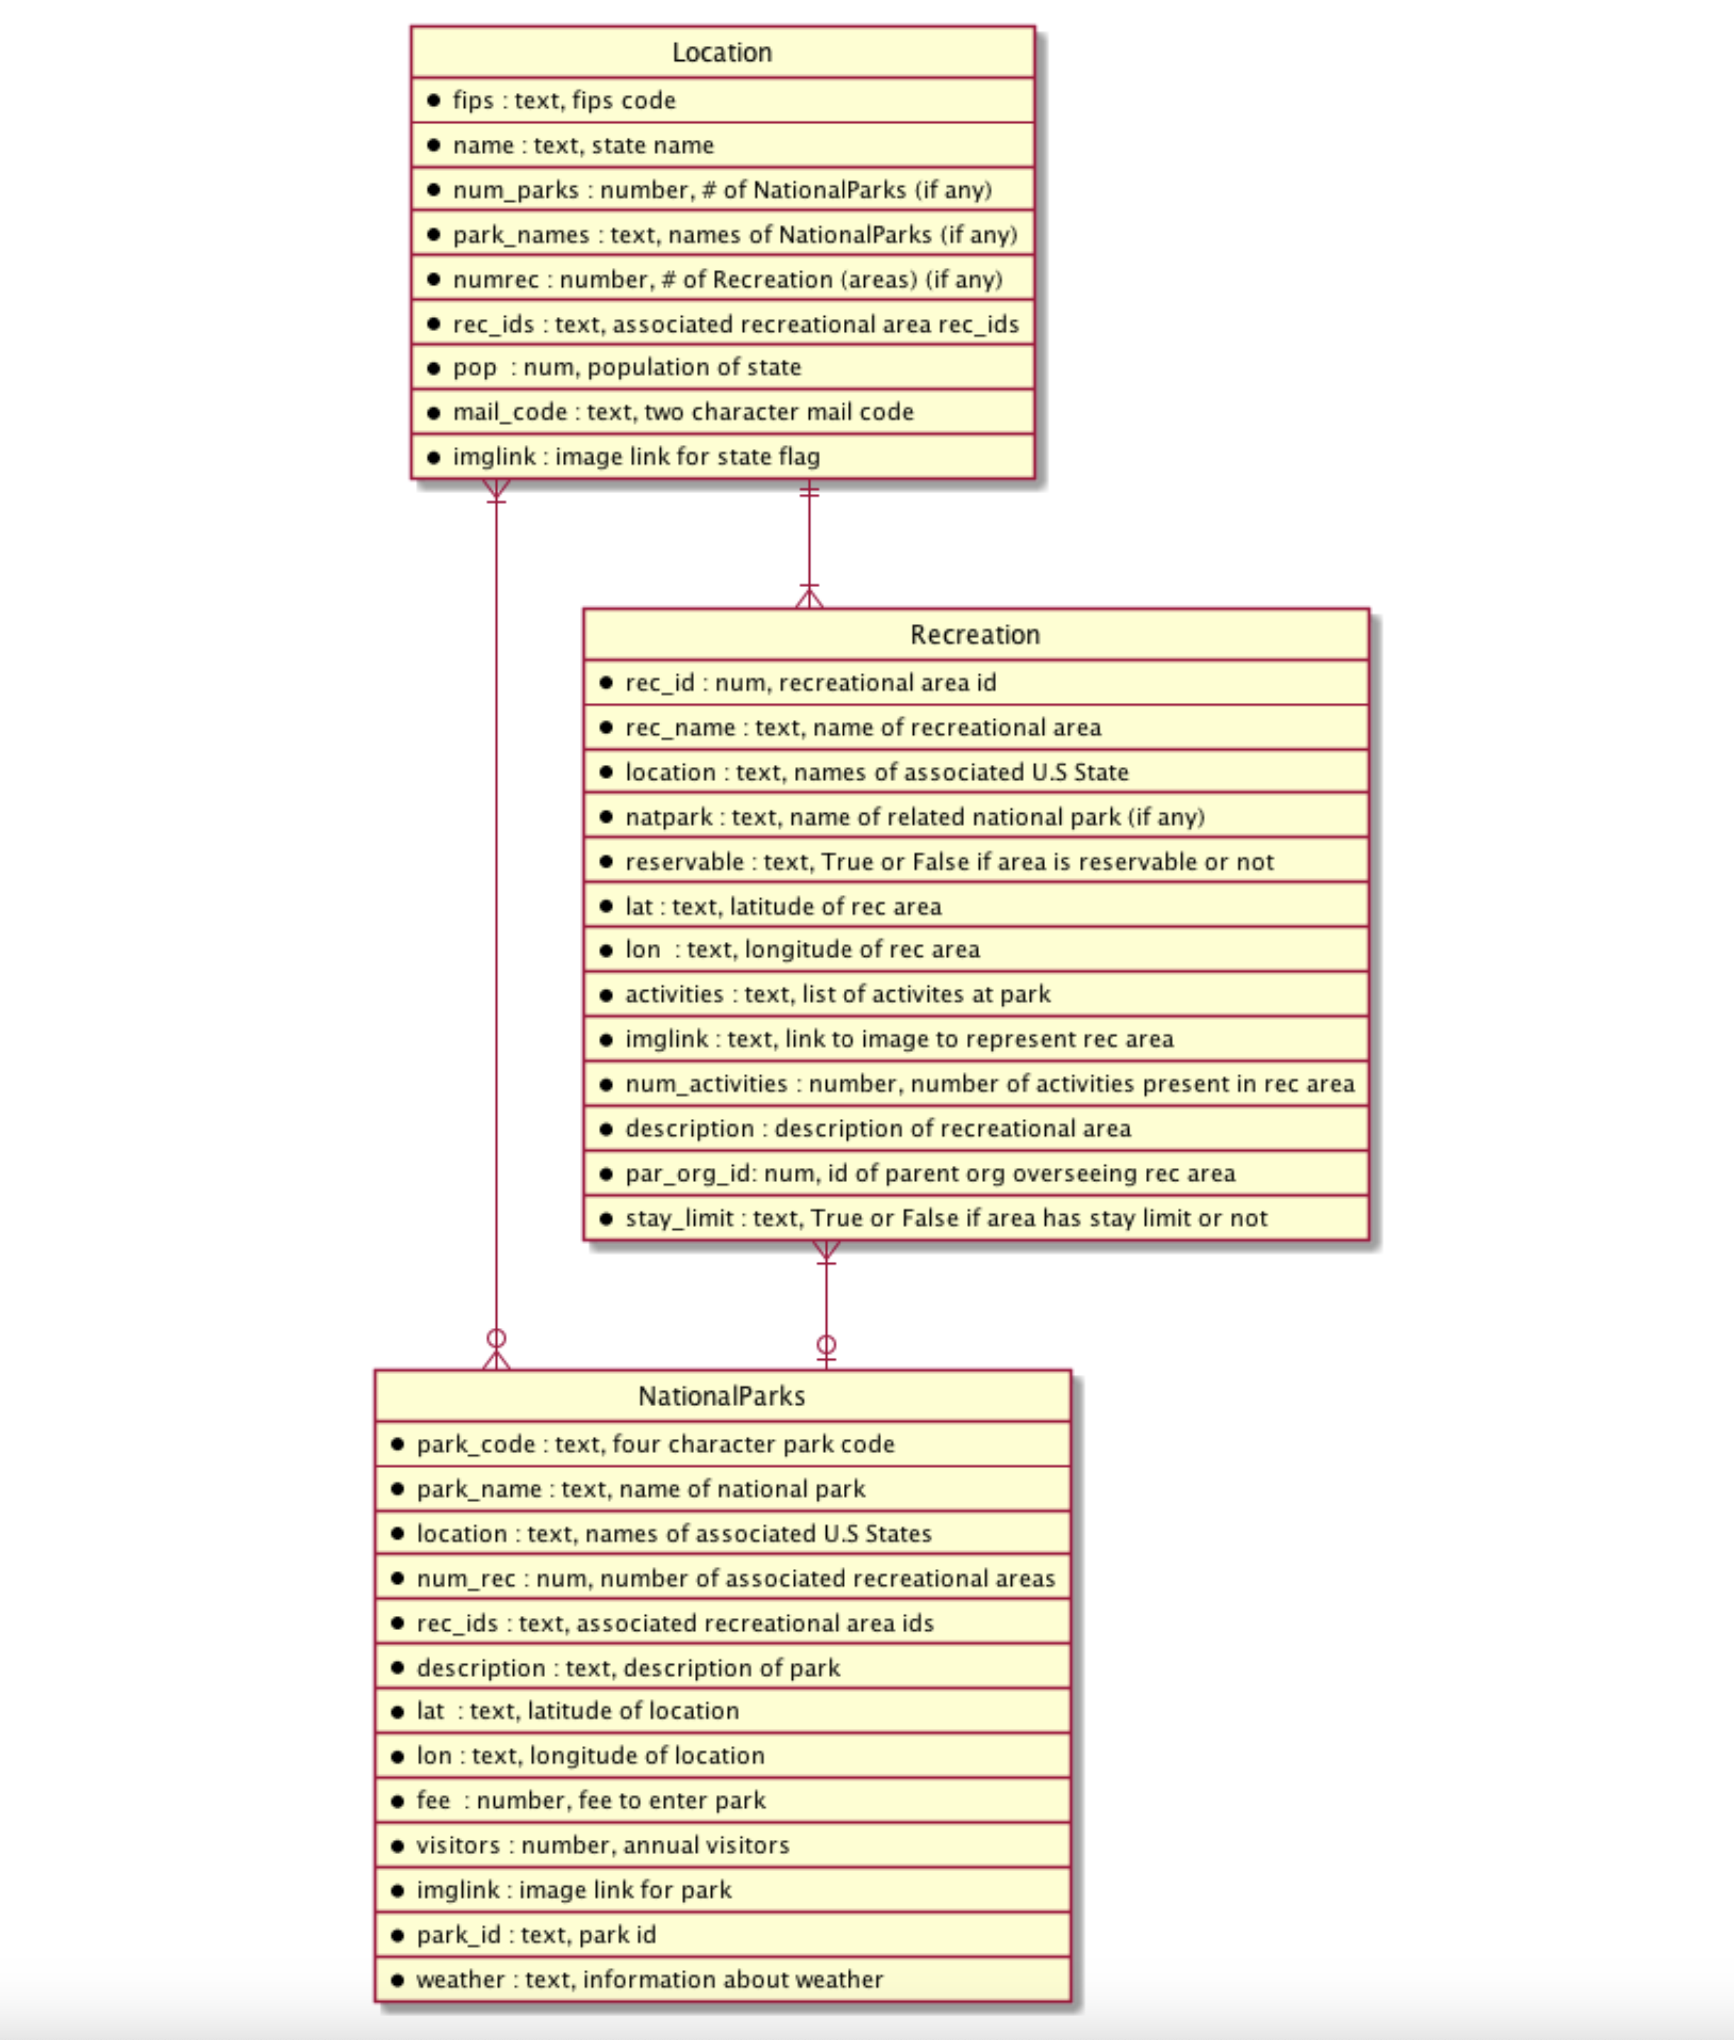
UML Diagram
Testing
Frontend unit testing
On the frontend, we used Mocha and Enzyme in order to facilitating the JavaScript which we wrote for the frontend. Currently, the tests test basic functionality of the project, such as rendering different components, and ensuring that the correct number of components are displayed on the models page. These tests were integrated into the CI/CD pipeline, so that whenever someone tried to make a new commit on the repository, GitLab would send an email if the new code did not pass the tests.
Frontend GUI Testing
In order to do acceptance testing and ensure that our code worked from a real world scenario, we wrote GUI tests using Selenium. The tests spin up Chrome Webdriver and perform browser actions, and then validate those actions to see that the correct behavior was produced.
Backend testing
Our backend uses Flask to serve up data from the MySQL database to the frontend. In order to test this functionality, we used Python unittest to ensure that the data that we were passing onto the frontend was what we expected.
Postman testing
Postman tests check the status number of the response, as well as if the json responses from the API endpoints contain the necessary and specific properties (attributes/fields) based on the model. Newman runs Postman tests located in the collection in the CI.
Filtering
Tools used
In Phase 3, we implemented our API using Flask Restless, which has a lot of built in functionality to support filtering. We built out a UI with dropdowns so that the user could select as many filters as they wanted to. Then, when the user applies the filters, the preferences are grabbed, and set along as query parameters to the Flask Restless backend, which will only return results that match all of the given filters. With Flask Restless, we can check any column value, and use the operations >, <, <=, >=, ==.
Filterable attributes
Locations
- Number of recreational areas
- Number of parks
- Population
National Parks
- Number of recreational areas
- Admission price
- Number of annual visitors
Recreation
- Reservable (T or F)
- Stay limit (T or F)
- Number of activities
Sorting
Sorting was very similar to filtering, in the fact that we took advantage of the tools already provided by Flask Restless in order to facilitate sorting. We built out a UI that allows the user to choose which attribute to sort by, and whether they want it in ascending or descending order. Once they apply the sorting, their choice (if any), is passed along as a URL parameter to the API, and the result is displayed to the user.
Sortable Attributes
Locations
- Location name
- Number of parks
- Number of recreational areas
- Population
- Mail code
National Parks
- Park name
- Location name
- Number of recreational areas
- Fee price
- Number of visitors
Recreation
- Recreation area name
- Recreation area ID
- Location name
- National park name
- Number of activities
Visualizations
Tools Used
We used d3.js to create the visualizations for our website. D3 allowed us to easily create scalable vectors based on the data provided from our API.
National Parks Visualization
What it Shows
For our national parks visualization, we projected the location (using the latitude/longitude attributes) of each national park on a map. We also took the annual park visitors attribute and were able to use this to create “circles” that became larger or smaller, depending on how many annual visitors there were to the park. This allows the user to see both the location of the national parks throughout the United States, as well as easily compare the popularity of the parks to each other. This visualization is currently on our site user the “National Parks” model and is interactive; if the user hovers over a circle, the number of annual visitors is displayed, and if it is clicked on the card of the associated national park appears.
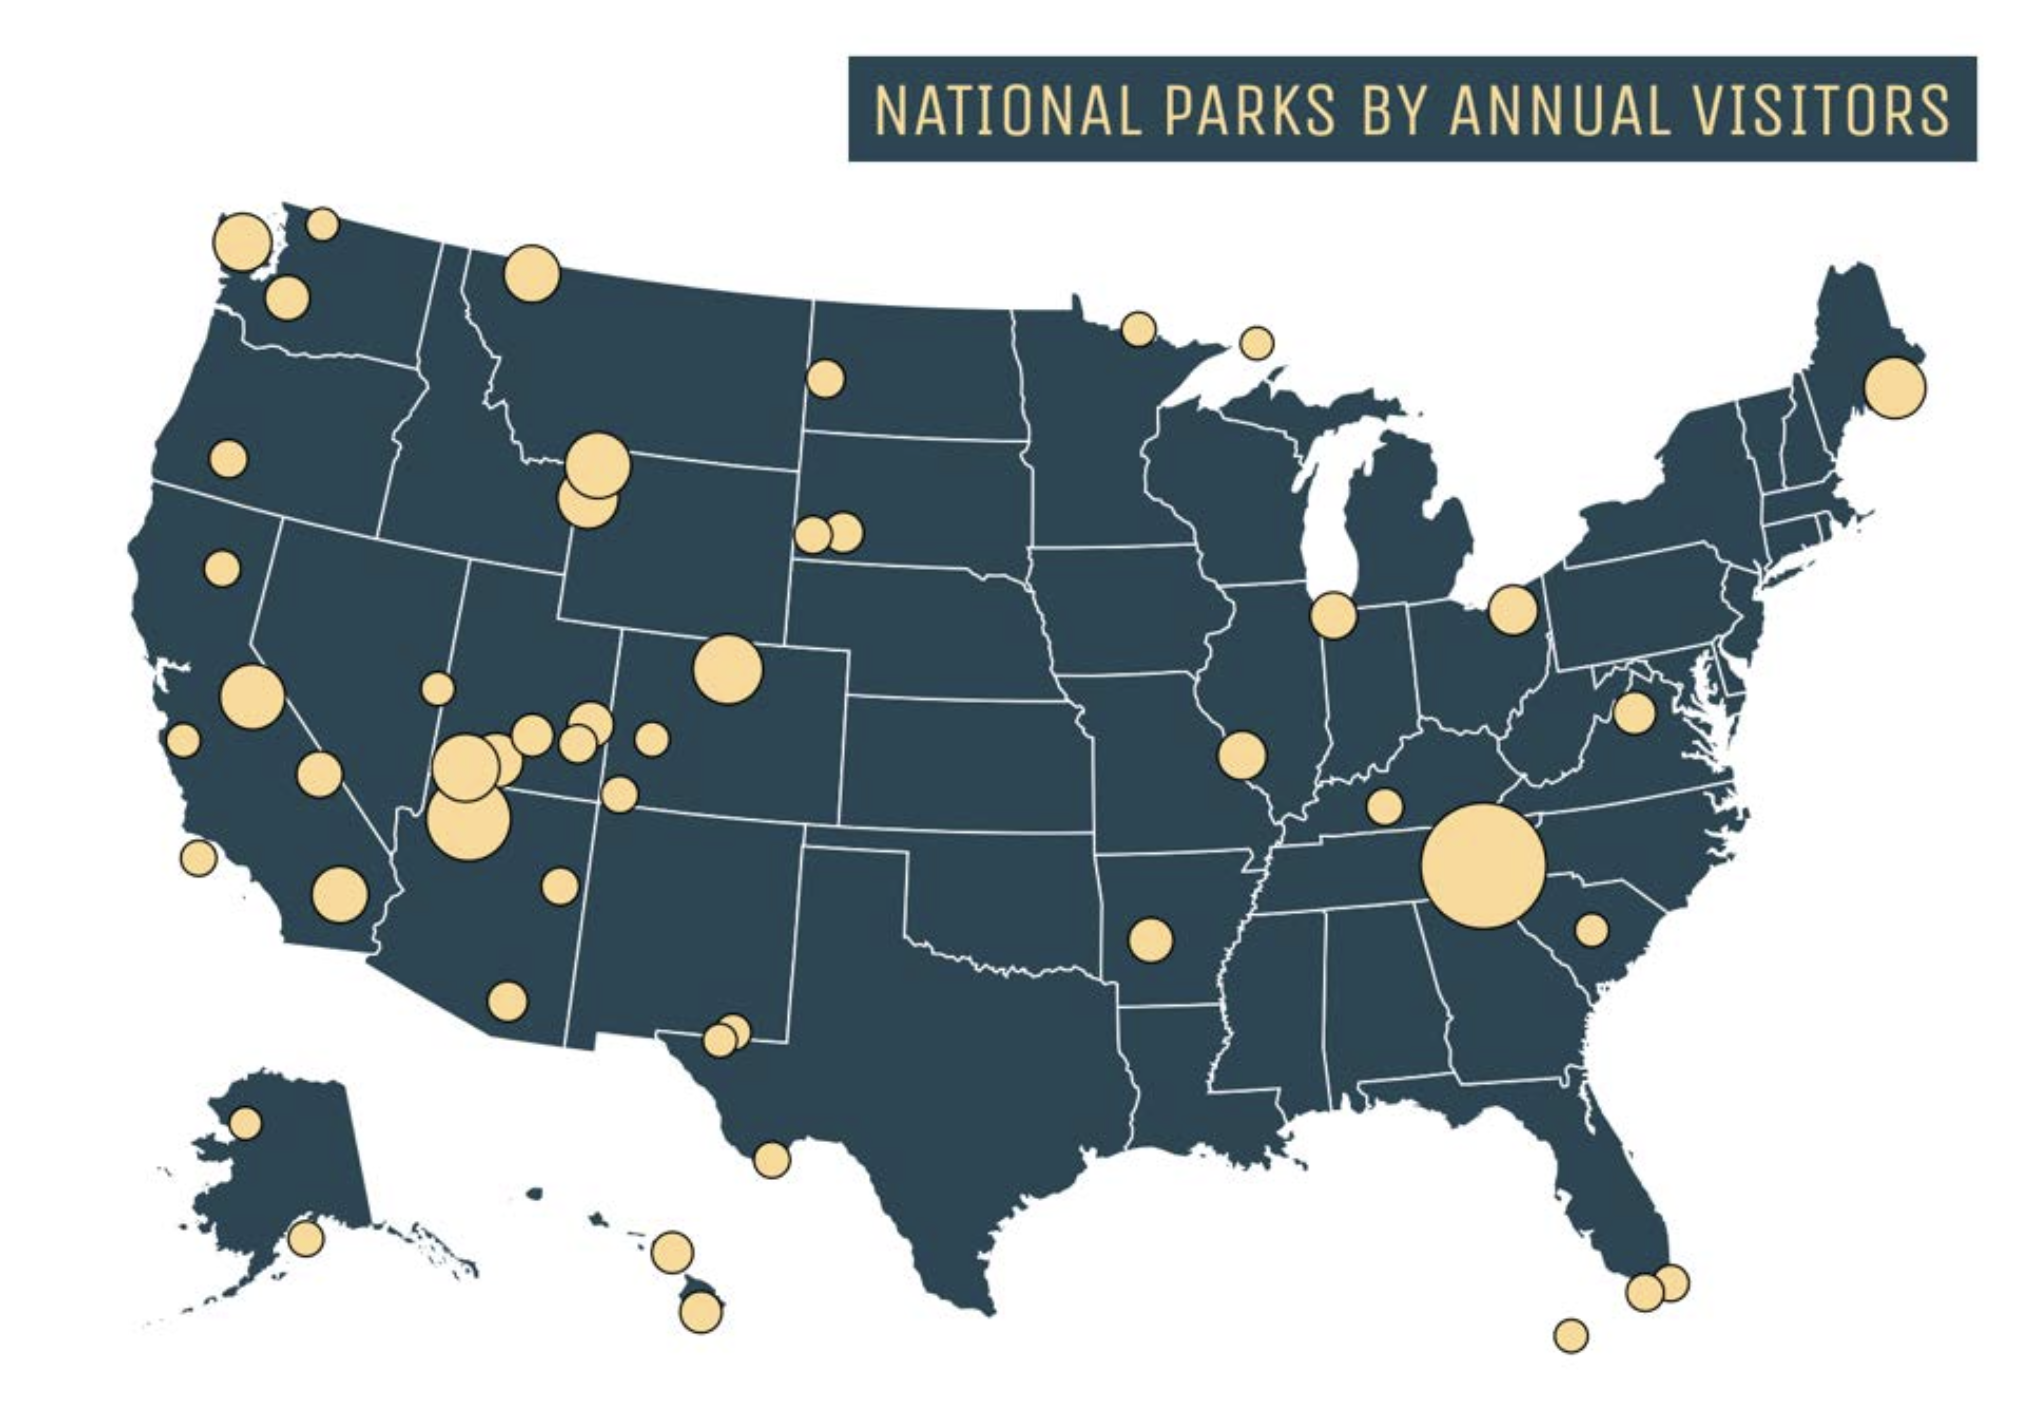
Visualization without user interaction:
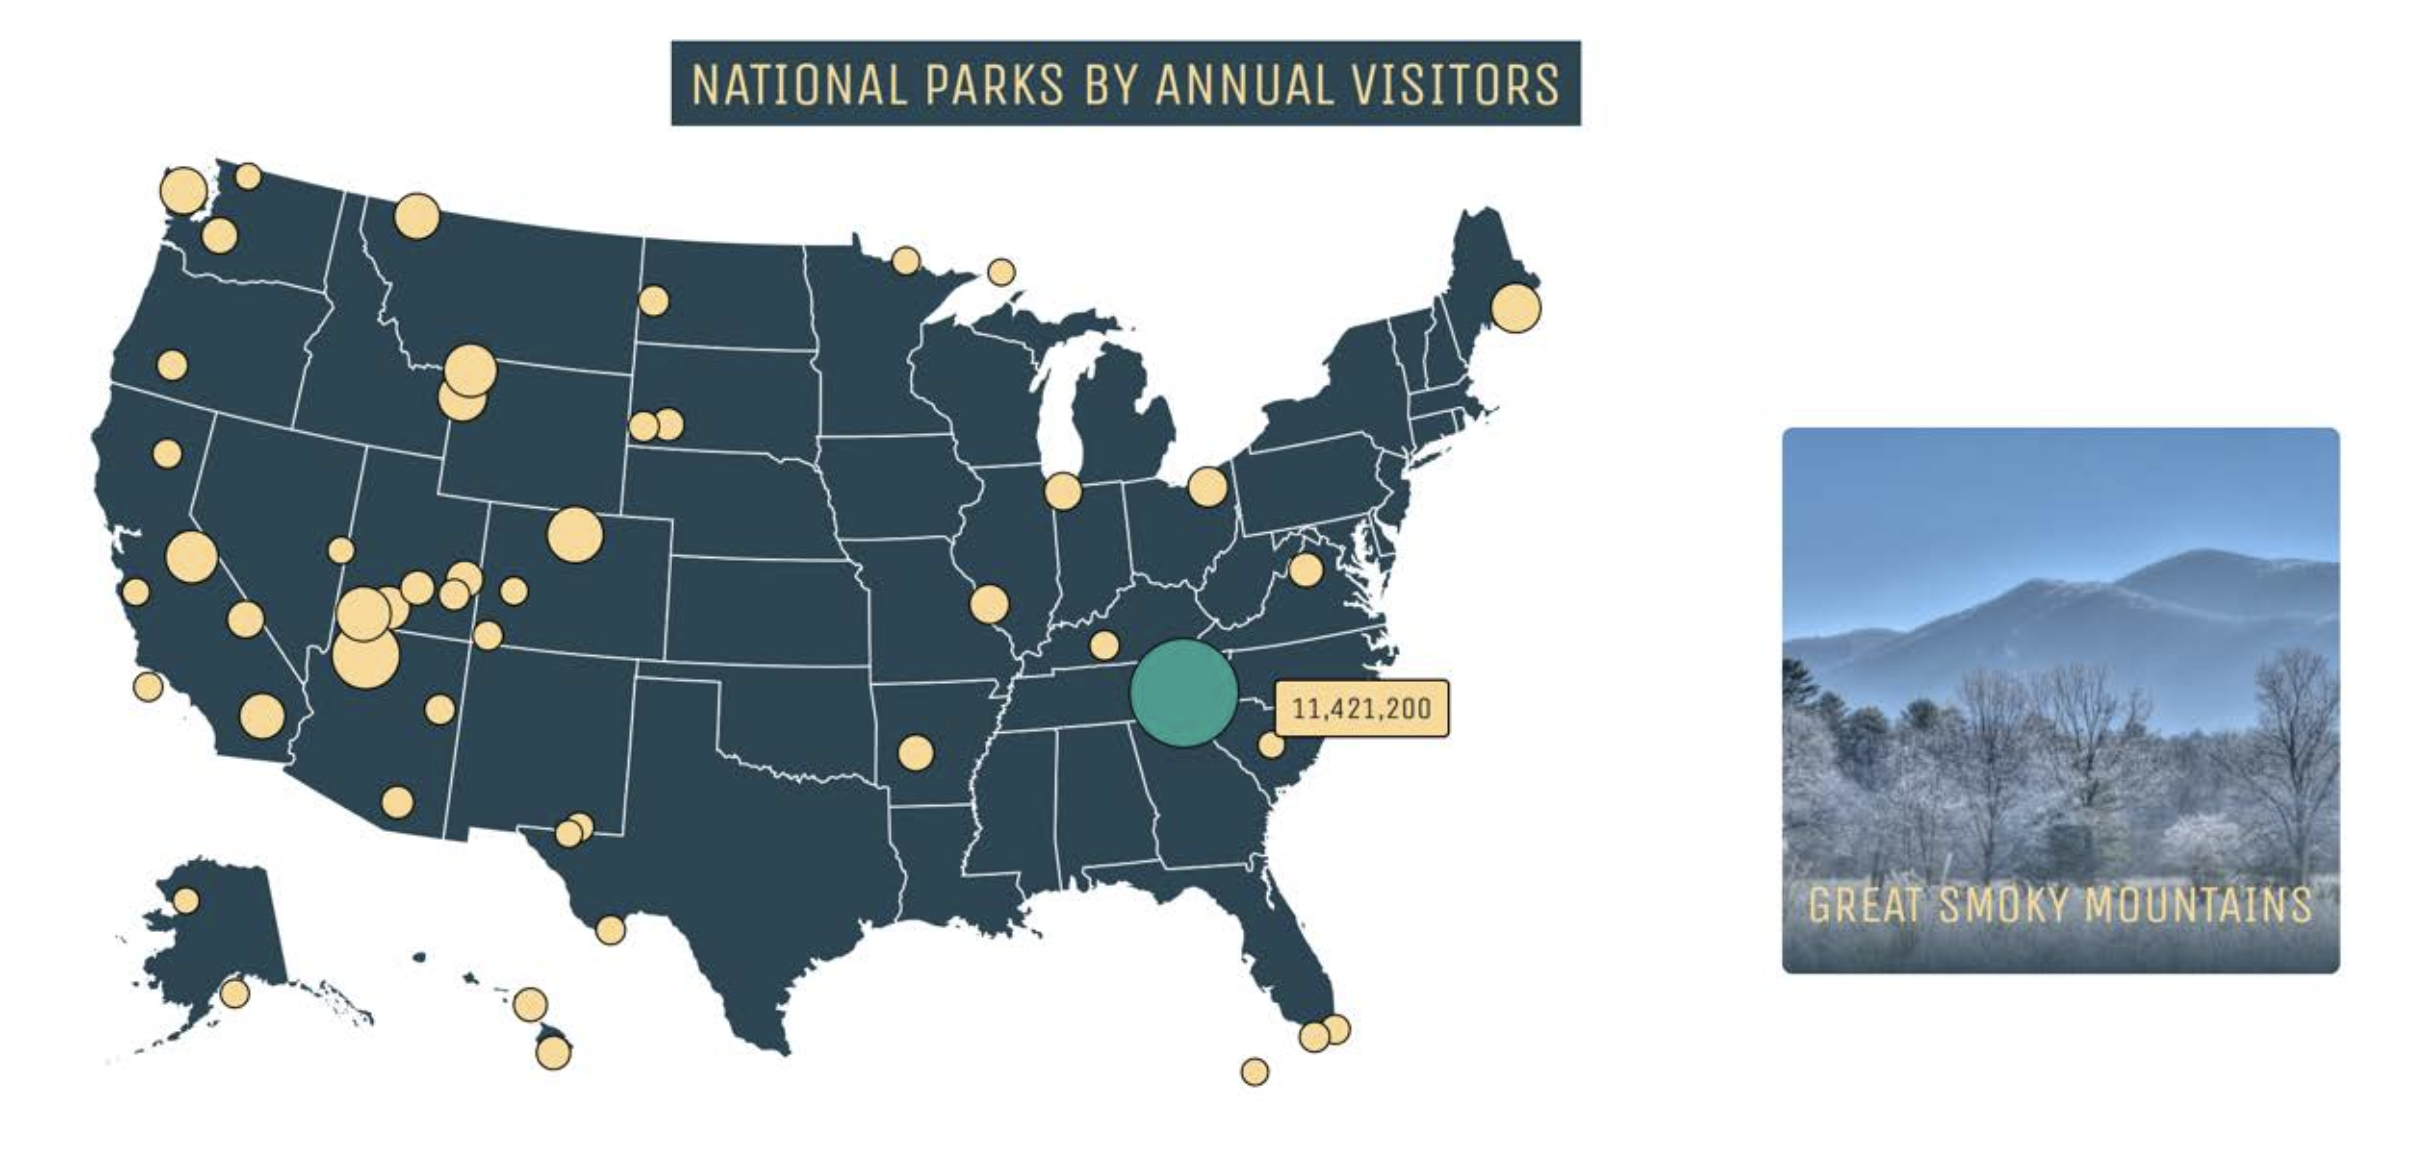
Visualization with user interaction:
What Questions it Answers
- Where are all parks located within the United States?
- What national parks are the most popular (by number of annual visitors)?
- Are there specific areas in the United States in which national parks are more prevalent?
- Are there areas of the United States that do not have easy access to national parks?
Recreation Visualization
What it shows
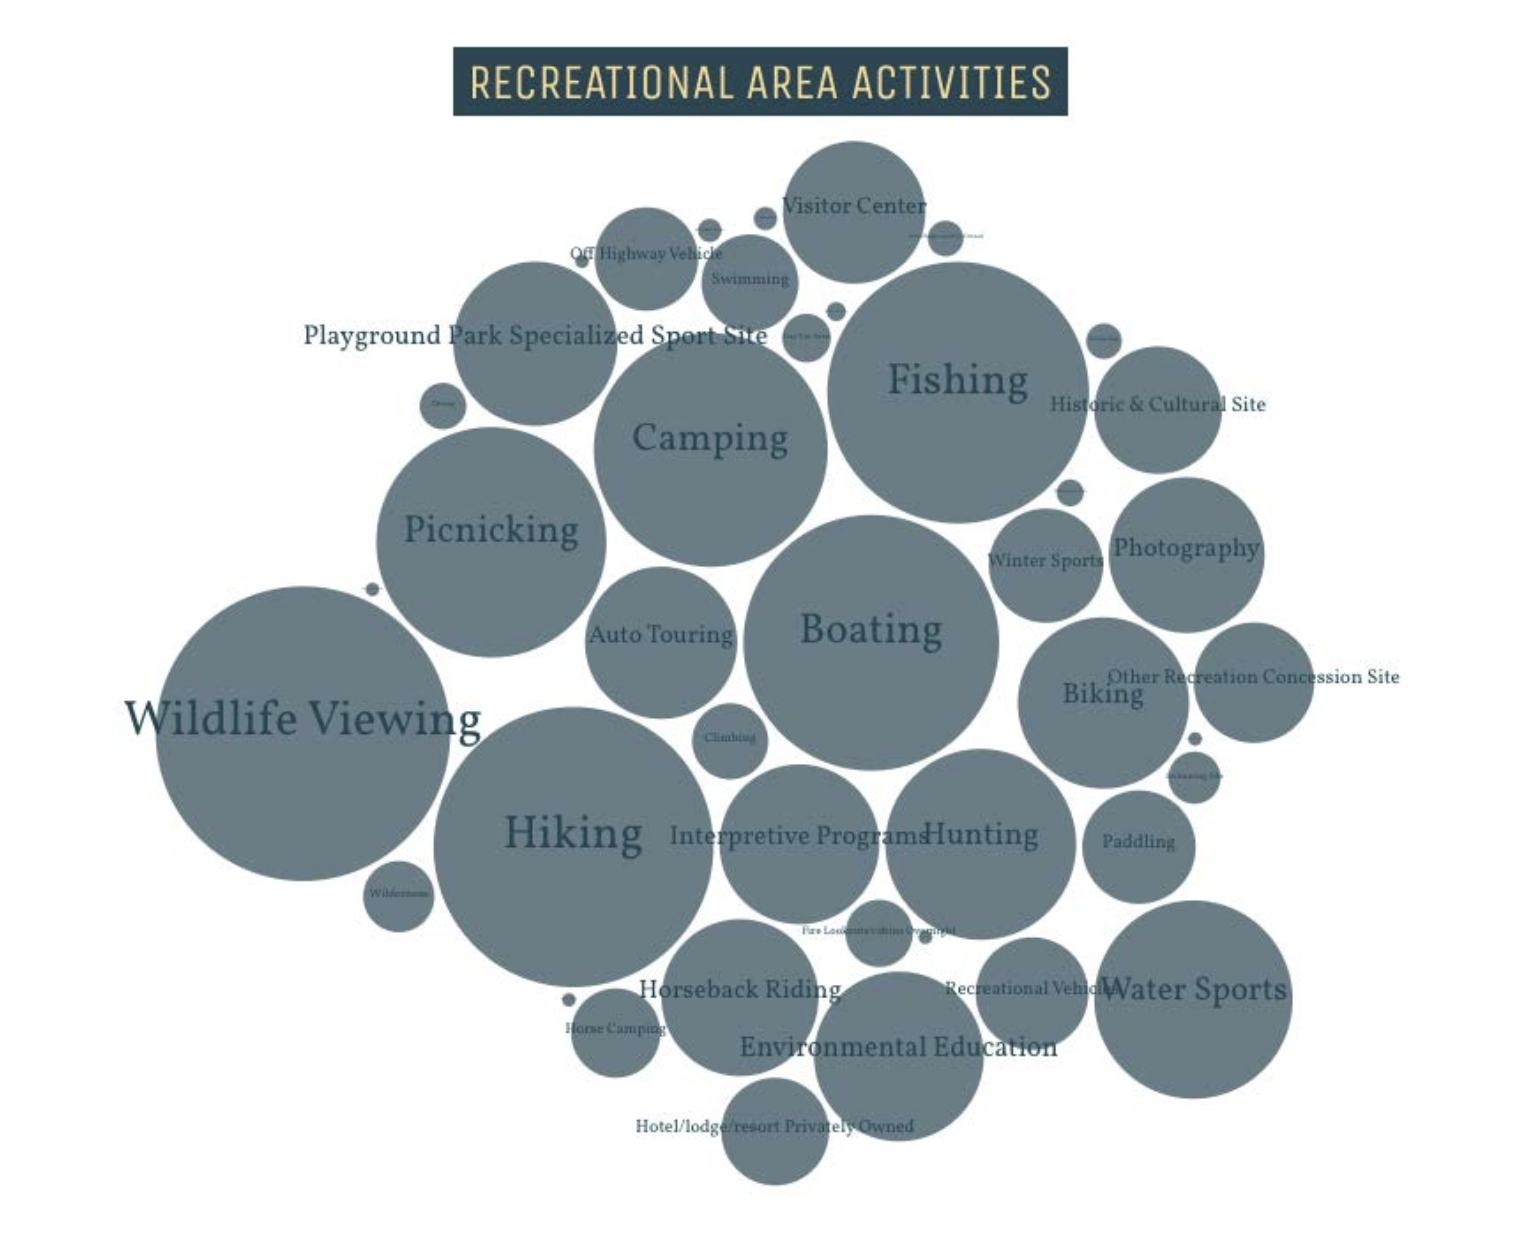
For the recreational areas visualization we collected all of the activities available at all of the recreational areas in the nation in order to visualize which activities were the most prevalent. In order to do this we fetch all recreation areas, and built out a map of all of the different activities (using the activities attribute), and how frequently they appeared. We used this to build a “bubble map” where the size of the bubbles corresponded to how many times the activity appeared.
This visualization is currently on our site user the “Recreations” model and is interactive; if the user hovers over a circle, the name of the activity and number of times it appears is displayed.
Visualization without user interaction
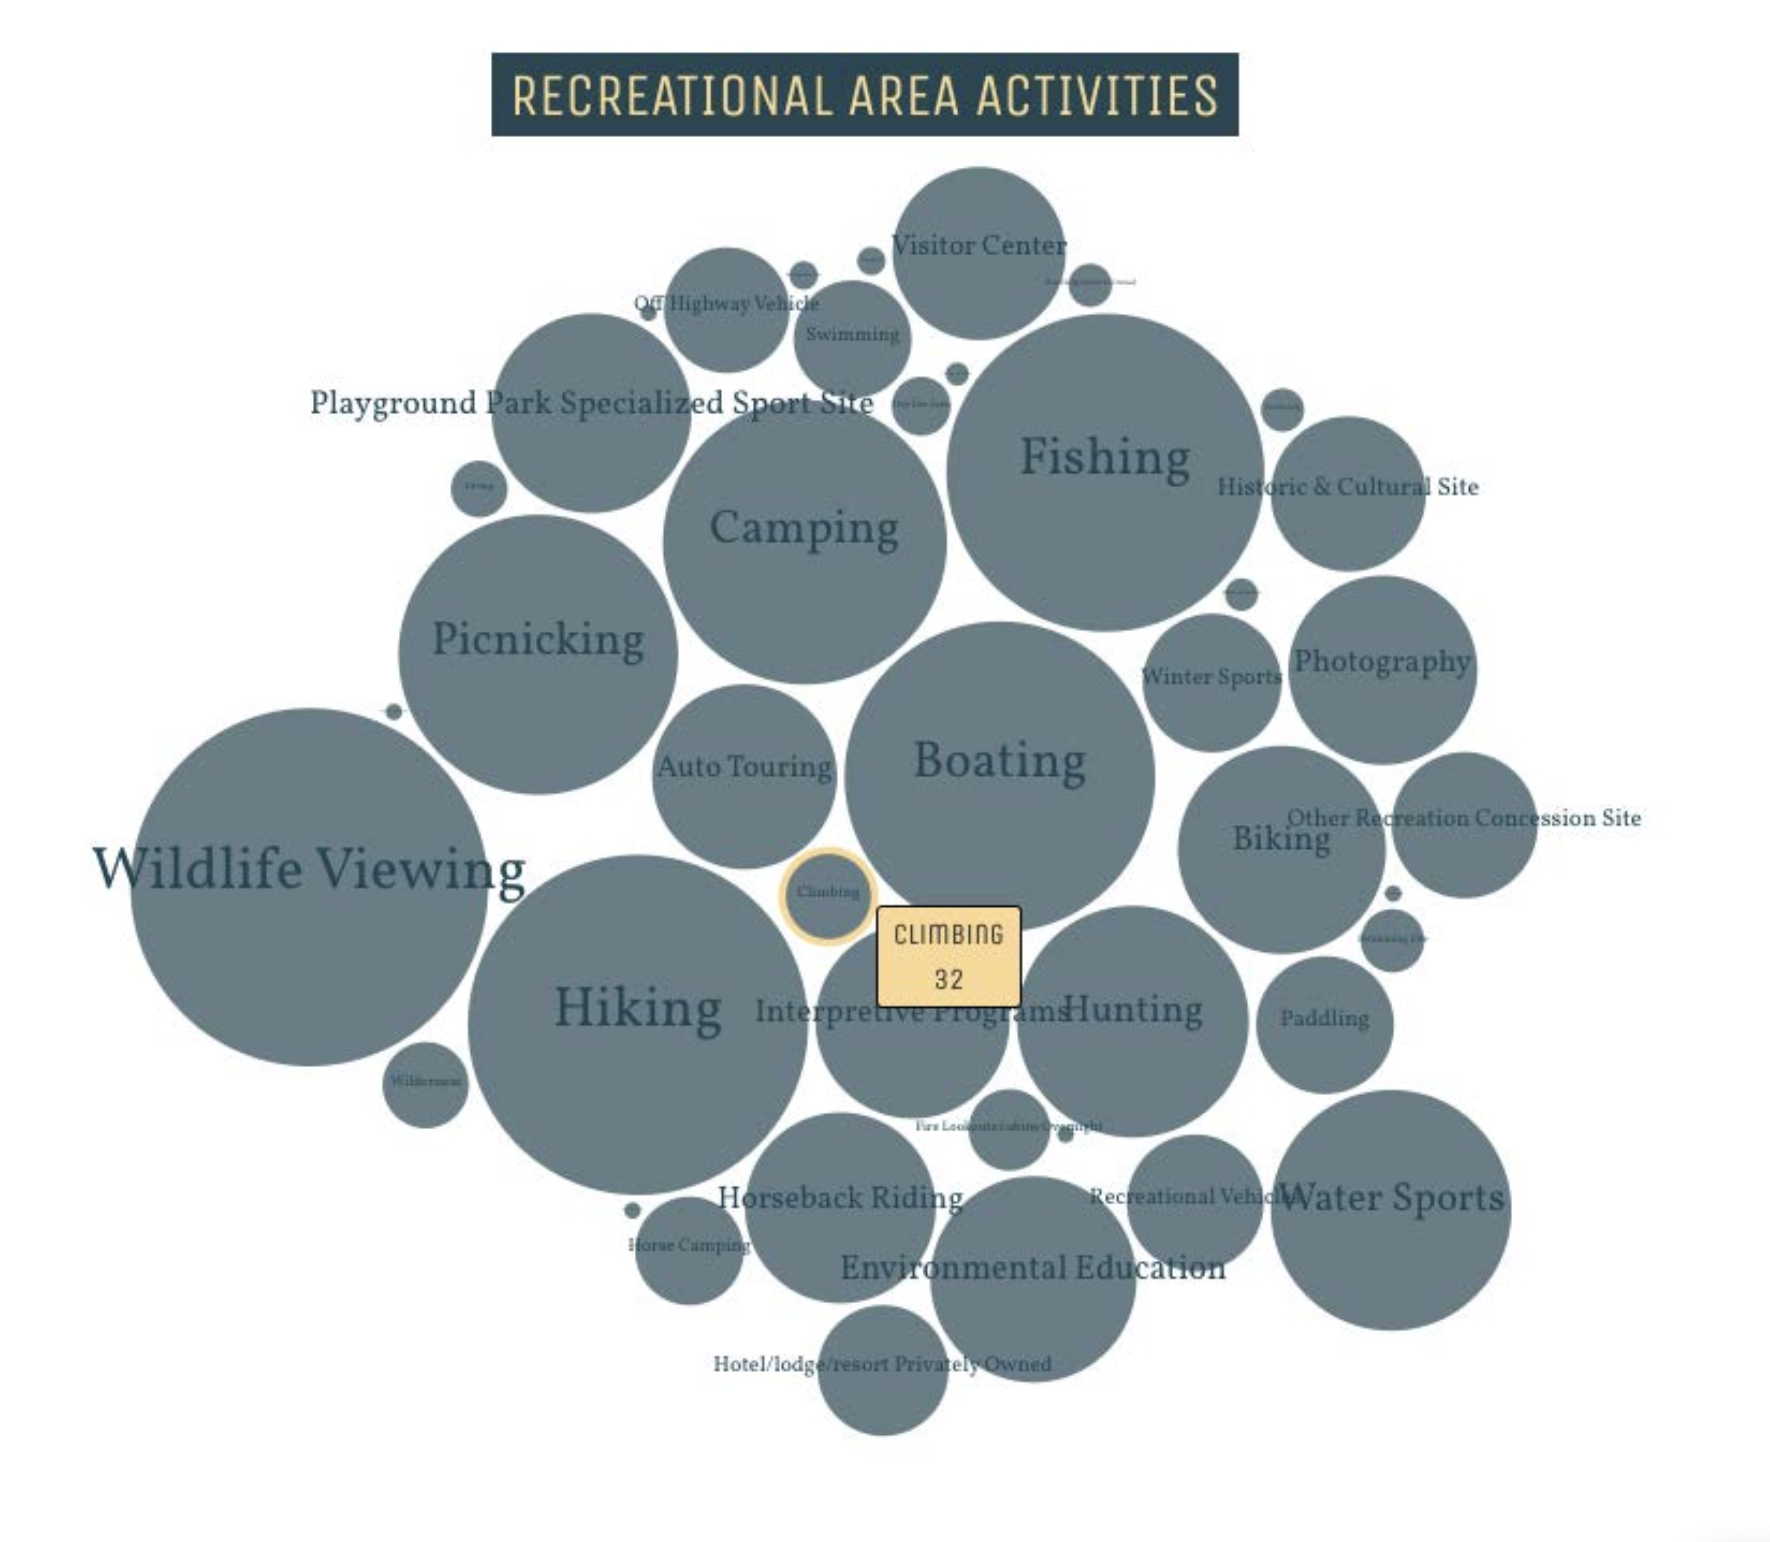
Visualization with user interaction
What Questions it Answers
- Which activities are most common at recreational areas?
- What activity will be most accessible for me to start learning?
- What type of activities can I expect at most recreational areas?
Location (States) Visualization
What it Shows
For our location visualization, created a “heat map” of various U.S states. The information from the heat map was populated by using the “number of national parks” and “number of recreational areas” attributes from the locations model. The states on the map became darker if there were more recreational areas/national parks within a state, and lighter otherwise. This allows the user to see what states have more recreational areas and national parks based on information we drew from the National Parks Service and Recreation Information Database.
This visualization is currently on our site user the “Locations” (or “States”) model and is interactive; if the user hovers over a state, the number of recreational areas plus the number of national parks is displayed. If the state is clicked, the card for the corresponding state appears.
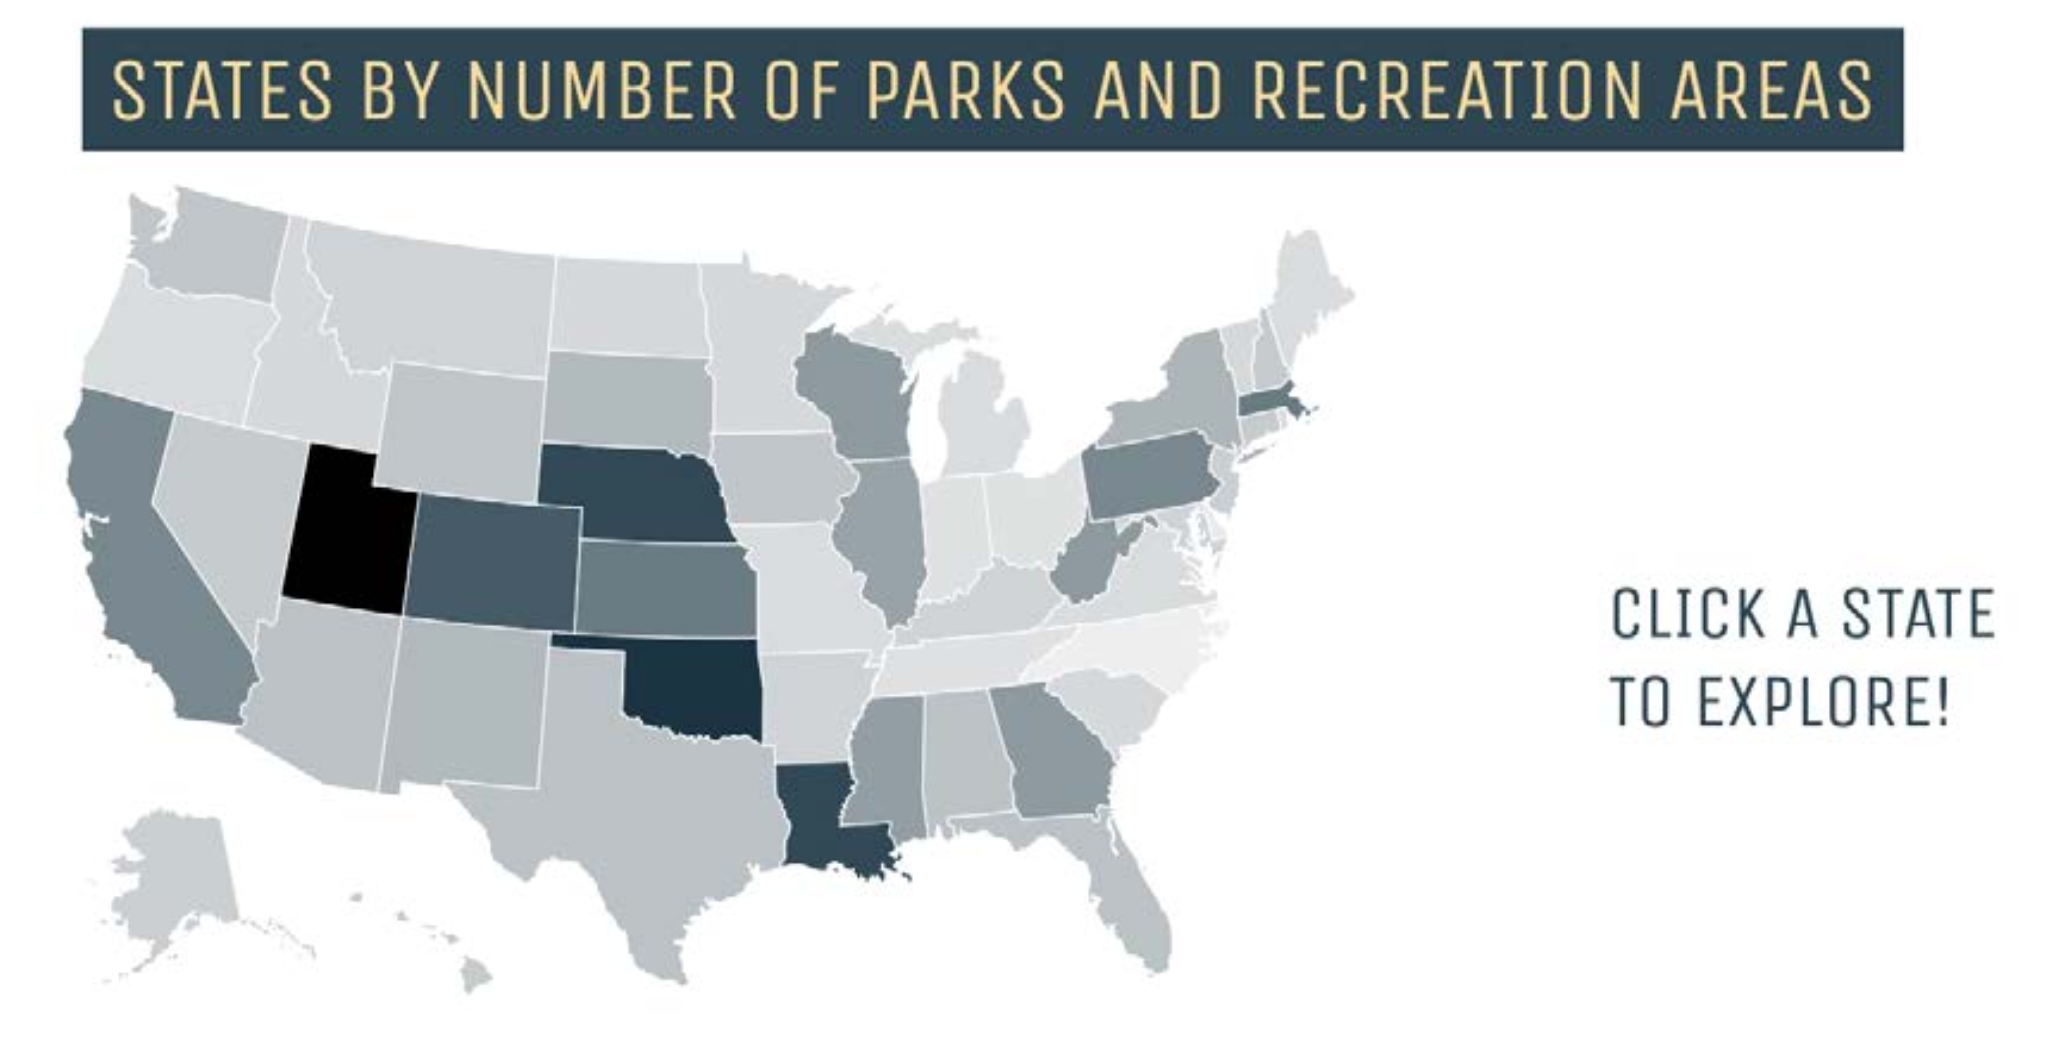
Visualization without user interaction:
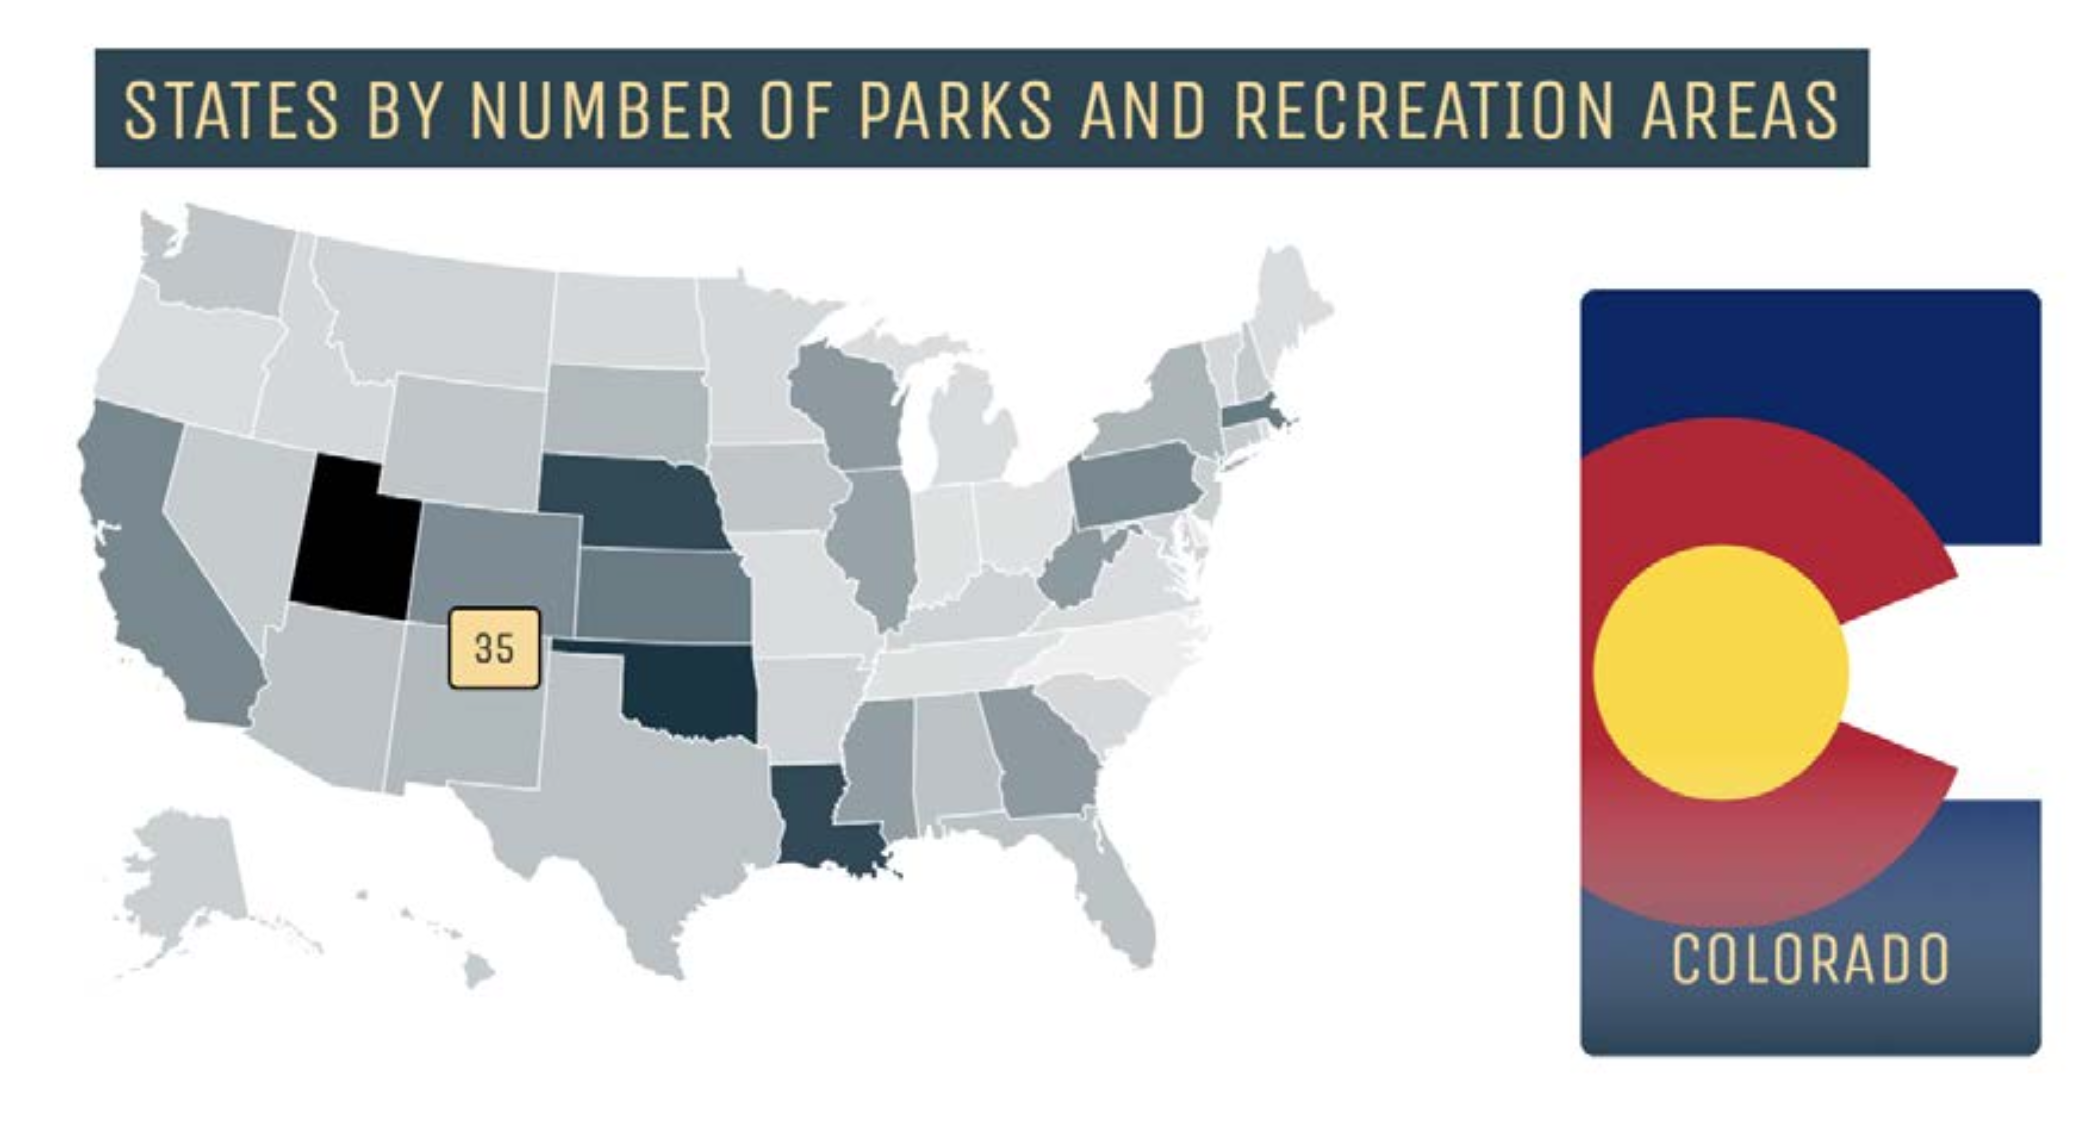
Visualization with user interaction:
What Questions it Answers
- What areas of the United States have the most opportunity for people to engage in outdoor activities?
- Do states that have national parks typically have more recreational areas?
Project Requirements
The website we were to make for this class was very specific. I searched for ages but was unable to find the exact requirements. To the best of my memory the requirements were as follows:
- Create a website that has 3 different data models - For our case we chose National Parks, Recreational Areas, and States.
- These models must all be interconnected. Each data model needs to directly relate to the other two
- There must be over 500 data points combined across all data models
- Each data model must have at least 50 data points
- Each data model must have at least 5 different attributes
- The data must be obtained from other API sources
- The data must be stored in a Google Cloud or AWS database
- You must create a web page for each data model
- You must be able to search within this data model
- You must be able to filter by at least 3 different attributes
- You must be able to sort in ascending and descending order at least 3 different attributes
- The data points displayed on the page must be paginated
- You must create a data visulization for each model
- You must create a web page for each data point
- The data point must link to data points in the other two models when appropriate
- You must have a landing page
- You must have an about page when the repository stats for each member
- You must have an api at
/apithat other teams in the class can use to fetch your data- You must create Postman documntation for the API
- You must have frontend test, backend tests, and end-to-end tests
- These tests must run as a CI job on commit