The Effect of Space Weather on Cosmic Rays Research Paper
The following is the result of a year of research for the ISEF (International Science and Engineering Fair) competition my senior year of high school 2016-2017.
The Effect of Space Weather on Cosmic Rays
Jacob Jeter, Maccoy Merrell, Levi Villarreal, Marley Jeske
Waxahachie Global High School
Abstract
Based on the research conducted by our team prior to the commencement of the study, we hypothesized that the muon flux would increase during hours of sunlight and decrease during the night. In addition, we hypothesized that the muon flux would be directly correlated to space weather measured in the atmosphere. Our goal was to not only find these correlations and fluctuations but to understand the reasons for the trends, and use the results to further the understanding of cosmic rays in our solar system. To accomplish this goal, we assembled a Quarknet Cosmic Ray Muon Detector and collected data over the course of five months. This data was analyzed in the form of muon flux studies and compared to electron flux and magnetometer data recorded by the GOES 13 and 15 space weather satellites. The comparisons showed that both electron flux and magnetometer correlated directly with the muon flux in a day-night cycle. These correlations were due to the changes in Van Allen belt strength, as well as the solar energetic particles received during the day. Analyzing these different trends allowed us to determine the percentage of solar energetic particles and galactic cosmic rays that bombard the Earth. Knowing this information will allow for a greater understanding of cosmic rays, and may lead to the prediction of extreme solar weather based primarily upon muon flux.
Background Information
Cosmic rays have been studied by physicists for decades, but despite the common occurrence of the phenomenon, many aspects remain a mystery. However, studies from around the world have provided basic facts for these high energy particles. Different classifications of cosmic rays include galactic cosmic rays, anomalous cosmic rays, and solar energetic particles emitted from the sun (Christian, 2012). Roughly 90% of primary cosmic rays that strike the Earth’s atmosphere are protons from hydrogen nuclei, 9% are alpha particles, and the other 1% are made from heavier elements such as lithium (Nakamura, 2012).
Cosmic rays bombard the Earth at a rate of roughly 10,000 rays per meter per second (CERN, 2017). However, when high energy cosmic rays impact atomic nuclei in the atmosphere, pions are created, which quickly decay to their preferred state, muons (National University of La Plata Physics Department, 2015). These muons shower down from the atmosphere to the surface of the Earth, covering every facet of the globe.
Muons can be detected by a variety of devices, including a scintillator detector, which is the device utilized to perform this study. This detector uses a series of four stacked counters (each with a scintillator and photomultiplier tube), which give off light when an ionizing particle passes through (National University of La Plata Physics Department, 2015). This data was used in conjunction with a GPS to chart how many muons were detected per second. Over a four-month period, our team collected sixty-eight days of benchmarked data to use in muon flux studies collected from October through January.
Data Use
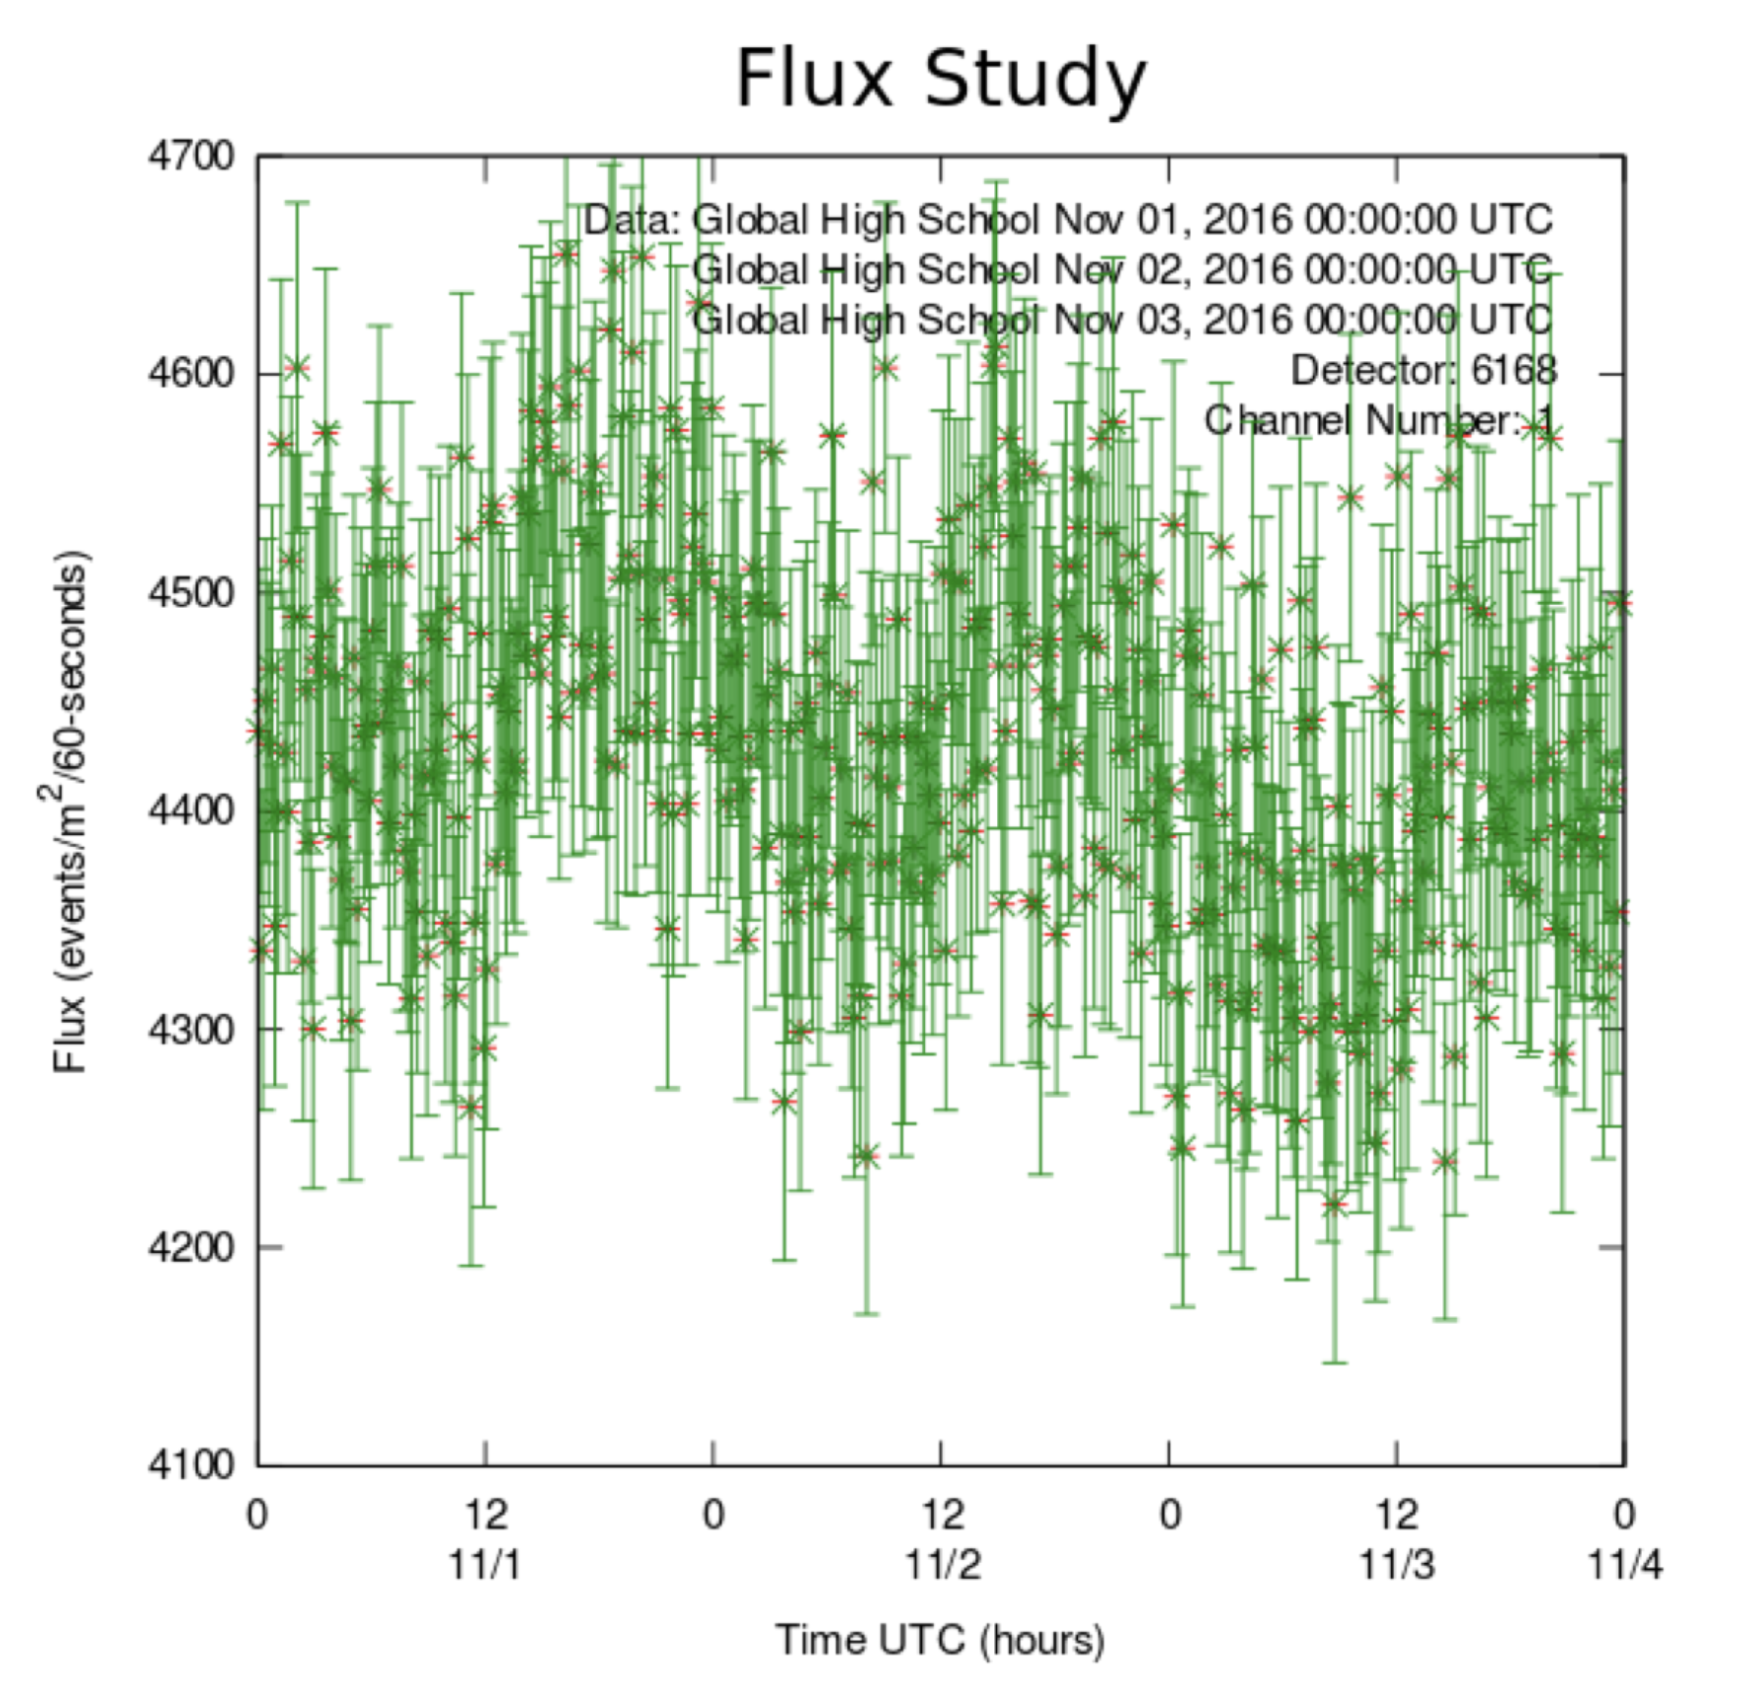
Using online tools found on the Cosmic Ray E-Lab, we ran muon flux studies over periods of three days to see how the rates fluctuated within a 72-hour period. What we found was a scatter plot resembling a jagged sine wave. From the chart, we could see that the highest muon counts were seen at midday local time, and the lowest counts were found in the middle of the night.

Figure 1. Muon flux data collected from the cosmic ray
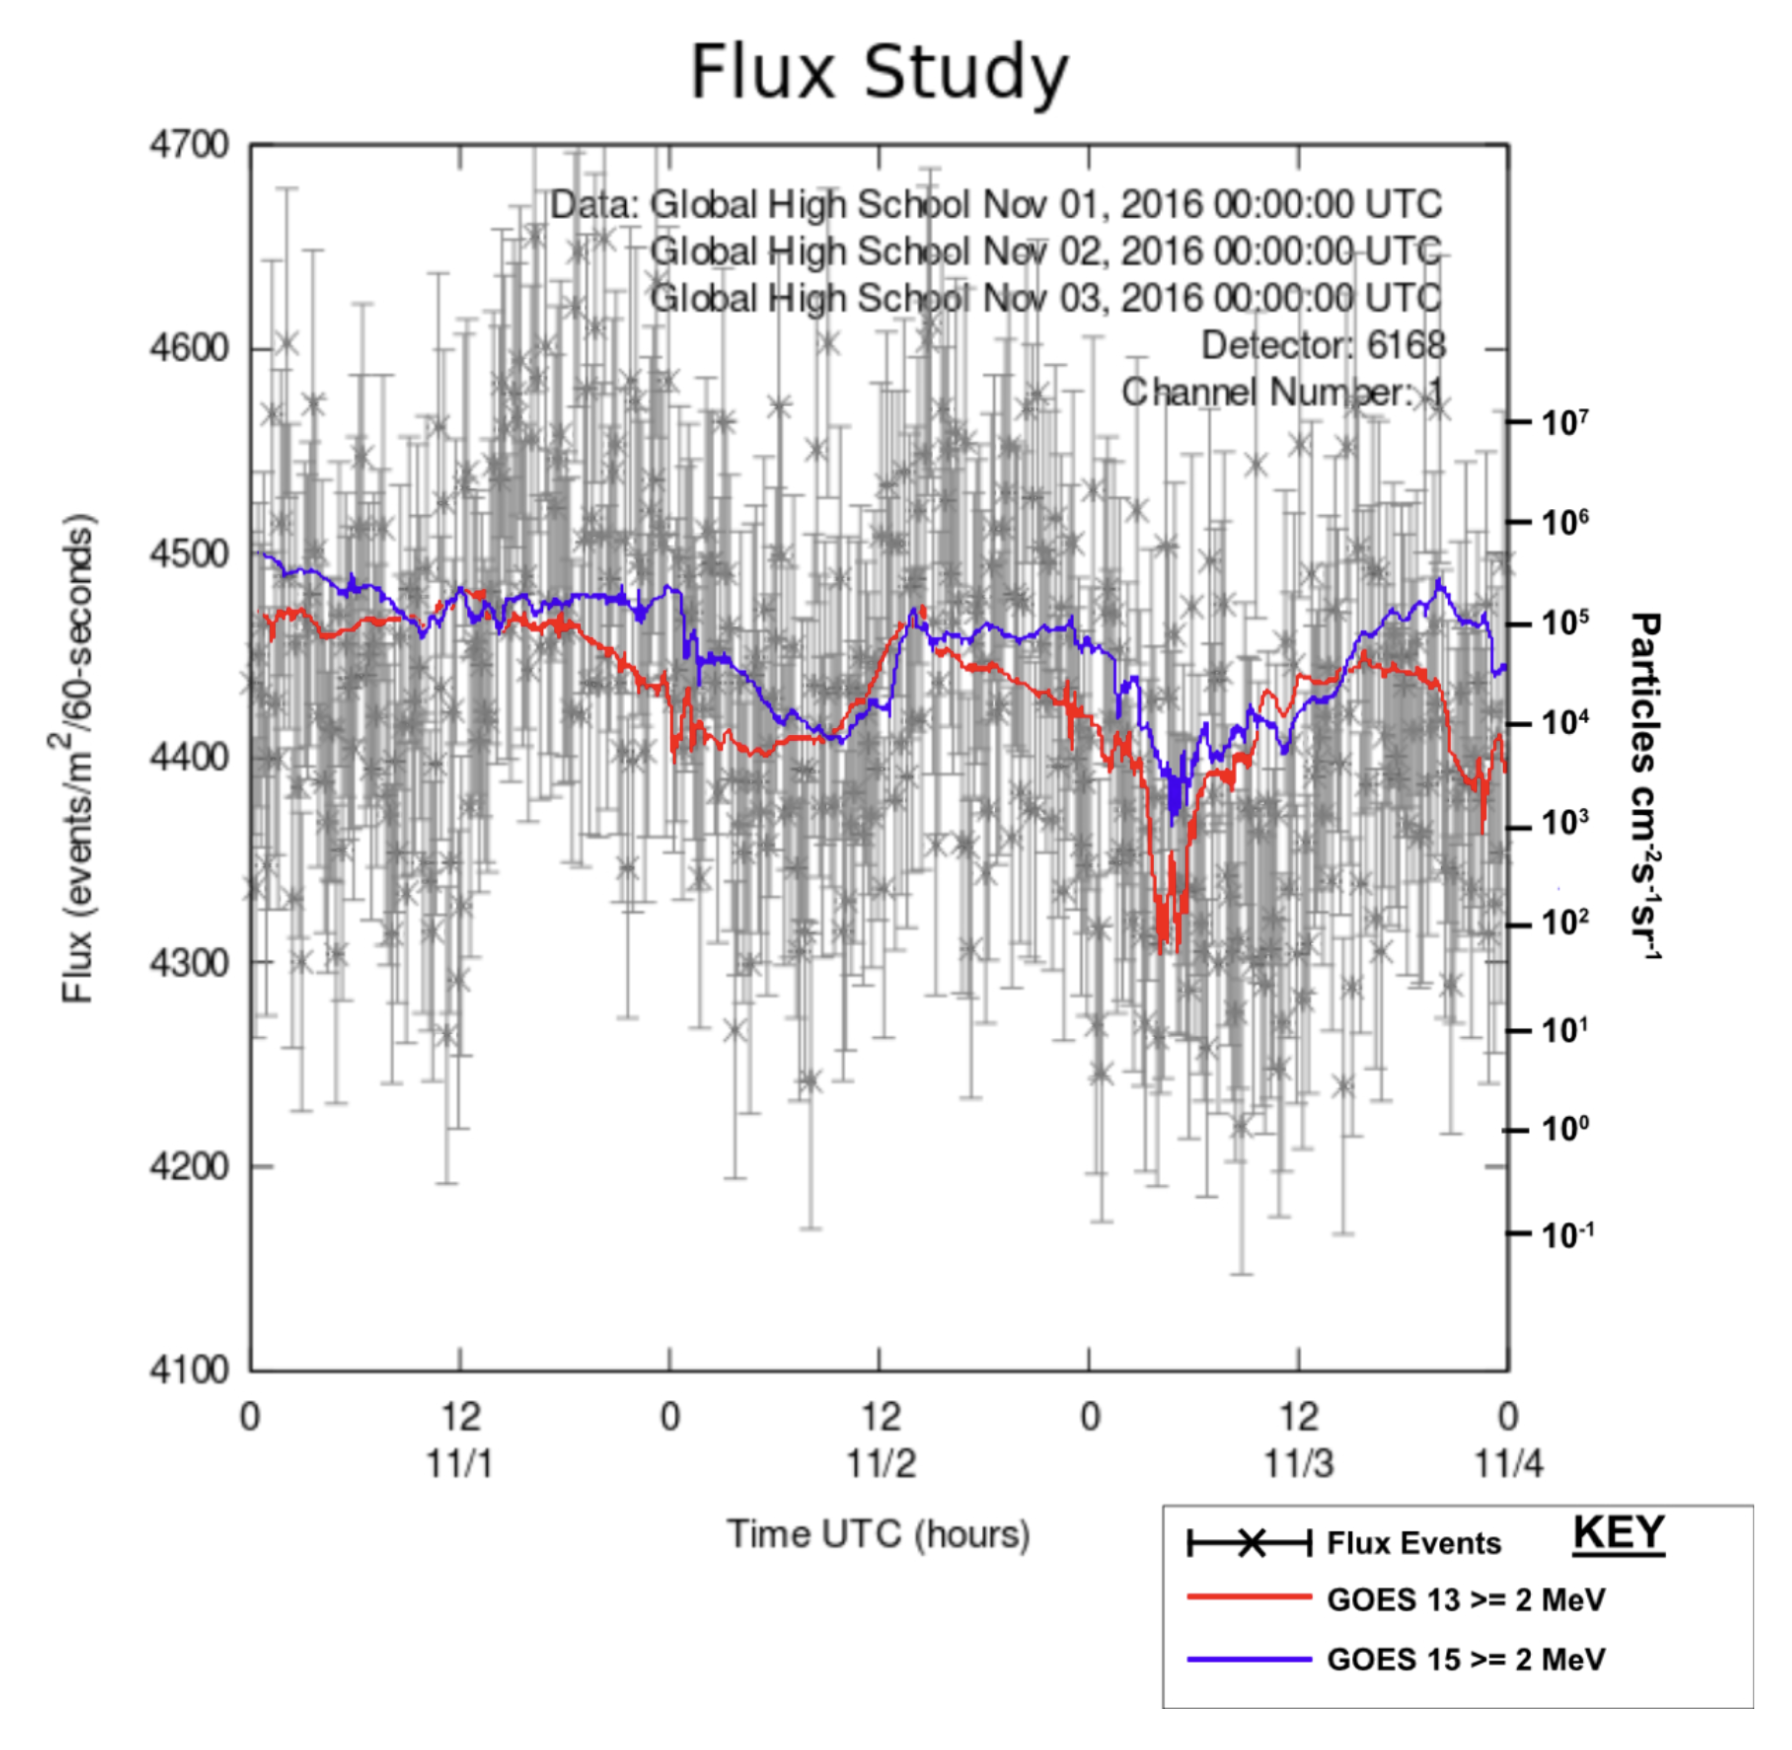
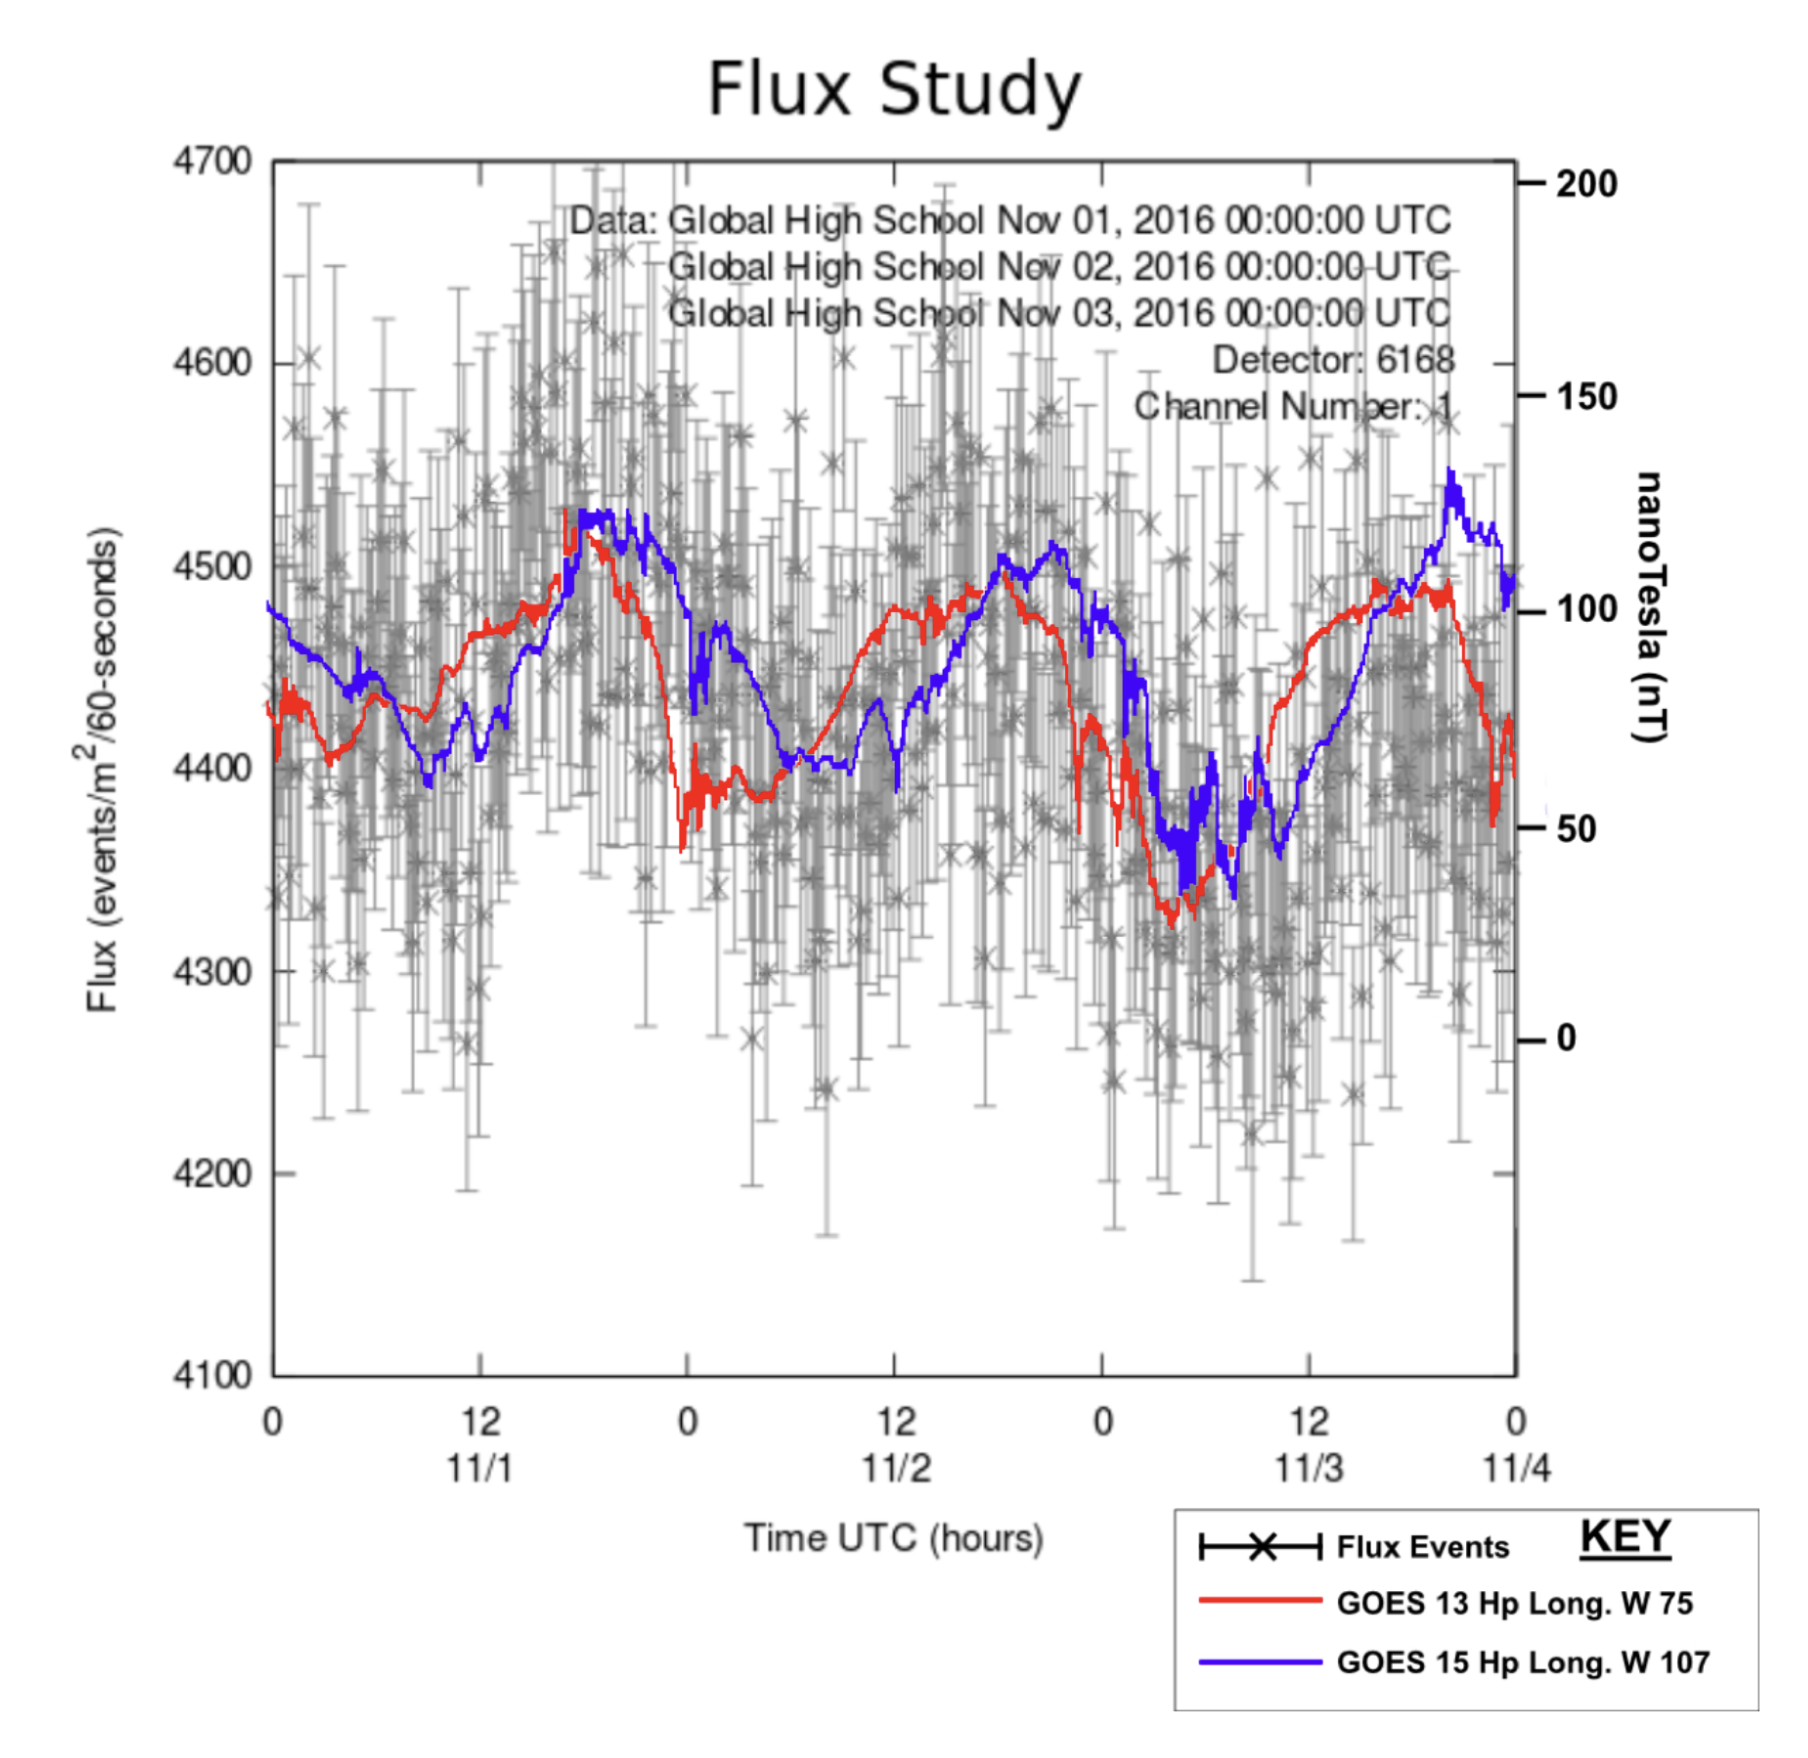
Using data available from the GOES 13 and 15 satellites to compare muon flux with space weather data, we found that the crests and troughs of the waves were nearly identical. When the graphs of both the electron flux and magnetometer data were overlaid, the similarities between the two became pronounced.

Figure 2: Muon flux data overlaid with GOES electron flux data. This figure illustrates the correlation of the two sets of data.

Figure 3: Muon flux data overlaid with GOES magnetometer data. This figure illustrates the near identical trends between magnetometer and muon flux data.
According to the Space Weather Prediction Center, the electron flux data indicates “intensity of the outer electron radiation belt at geostationary orbit” (NOAA, 2017). The two integral flux channels record particles at different intensities and plot them in relation to the time the measurement was taken. Similarly, the magnetometer data plots the strength of geomagnetic fields at a specific time of day. From Figure 2 and Figure 3, it can be shown that both the electron flux and magnetosphere data correlate with the muon flux recorded by our detector.
The explanation for the correlations lies in the way the sun interacts with the magnetosphere of the Earth. The GOES satellites are currently in geostationary orbit above the west coast of the United States, so all measurements regarding time are in relation to Pacific Standard Time (Dunbar, 2015). The flux of the magnetometer correlates with a day-night cycle, where the magnetic fields peak midday and drop during the night. As solar wind interacts with the magnetosphere, the strength of the magnetic field increases, accounting for the rise during peak hours of solar wind activity (SpaceWeather, 2008).
Data Explanation
As the earth revolves, the magnetosphere strengthens as our location approaches perpendicularity with the Sun. As the Van Allen Belts are part of the magnetosphere, they also strengthen (Fox, 2014). This allows for more electrons to be captured in the belt from cosmic rays headed toward the Earth. This increased number of electrons in the Van Allen Belt produces the electron flux observed by the NOAA GOES satellites. This interaction usually takes place with the isotope protium, which contains one proton and one electron. When this singular electron is stripped from the atom, a hydrogen ion is created, and the energy of electronegativity is transferred to the proton which is still headed towards the Earth (Case Western Reserve University Physics Department, 2002). These protons contain additional energy, meaning they have a higher chance of producing pions when colliding with ions in the upper atmosphere (Fowler, n.d.). It is these pions that decay into the muons that we record (Nave, 2016).
Although the Van Allen belt does cause fluctuation in muon flux, the chart also shows a sharp increase around noon local time. This can be explained by solar emission particles which come from the sun. During the day, the Earth is bombarded with solar emission particles, in addition to the galactic rays originating from outside our solar system. However, during the night our position on Earth is facing away from the Sun, meaning that little to no solar emission particles will reach the cosmic ray muon detector since cosmic rays cannot travel through the entire Earth under normal circumstances (Mewaldt, 1996). These solar emission particles cause an additional increase in muons during the day but are absent during the night.
Implications
This fluctuation also allows us to study exactly how much of an increase the solar emission particles contribute to muon flux. Our data takes the form of a sine wave, typically fluctuating within a range of 200 events in a 24-hour cycle, with the peak of the sine wave correlating with local zenith, which is 6 hours behind UTC. During the months which we recorded muon flux, we had a wide variety in the values of hits at the peak and trough, though the range of data was always approximately the same. At midnight local time we can assume that the only muon flux data we are receiving is a result of entirely galactic cosmic rays. Because of the correlation of galactic cosmic rays, we can use the graph of magnetometer provided by NOAA to find the data of galactic rays alone, without solar emission particles. Using this process, the number of galactic protons can be represented by -50 cos(x) + 4450. From this, at the noon peak of November 1st, we get a value of ~4500 muons from galactic sources which would leave approximately 100 muons from Solar Energetic Particles. This means that at the peak period of sunlight, an average of 2.22% of the muon flux observed on the Earth is a result of solar emission particles.
This data can bring a greater understanding as to where the cosmic rays observed on Earth are coming from, and what they mean to the billions of people living. A possible implication of this data could be in space weather storms. Solar energetic particles have long been a major component in space weather storms and can cause problems with technology both in and around the Earth. These particles can penetrate satellites and cause failure, which is catastrophic for instruments that rely upon such technology (European Space Agency, 2011). In addition, solar energetic particles can block radio communications at high altitudes, sometimes jamming the signal of a pilot’s radio. However, with data explaining exactly how much of the muons received on Earth are a result of solar emission particles, one can study the trends in data to predict satellite failure days or even weeks in advance.
From both the data collected by our cosmic ray muon detector and the data utilized from the GOES space weather satellite, we have been able to calculate what percentage of cosmic rays that reach the Earth are solar emission particles. The fluctuation of the data is explained both by the stripping of electrons by the Van Allen Belt during the day, as well as the absence of solar emission particles during the night. By comparing the trough of the muon flux to the trough of magnetometer flux, the data resulting from galactic cosmic rays can be assumed, resulting in the percent composition from the different cosmic ray sources. This information aids in the understanding of cosmic rays and might even be able to be used to predict space weather storms in the future.
References
Case Western Reserve University Physics Department. (2002, July 23). The Proton-Proton Chain. Retrieved from: http://burro.cwru.edu/academics/Astr221/StarPhys/ppchain.html
CERN. (2017, January 1). Cosmic rays: particles from outer space. Retrieved from: https://home.cern/about/physics/cosmic-rays-particles-outer-space
Christian, E. R. (2012, May 11). Cosmic Rays. Retrieved from: https://helios.gsfc.nasa.gov/cosmic.html
Dunbar, B. (2015, November 25). GOES Satellite Network: GOES-N-Series. Retrieved from: https://www.nasa.gov/mission_pages/goes-n/index.html
European Space Agency. (2011, July 4). Radiation: Satellites’ Unseen Enemy. Retrieved from: http://www.esa.int/Our_Activities/Space_Engineering_Technology/Radiation_satellites_unseen_enemy
Fowler, M. (n.d.). Transforming Energy into Mass: Particle Creation. Retrieved from: http://galileo.phys.virginia.edu/classes/252/particle_creation.html
Fox, K. C. (2014, November 26). NASA’s Van Allen Probes Spot an Impenetrable Barrier in Space. Retrieved from: https://www.nasa.gov/content/goddard/van-allen-probes-spot-impenetrable-barrier-in-space
Mewaldt, R. A. (1996). Cosmic Rays. Retrieved from: http://www.srl.caltech.edu/personnel/rmewaldt/cos_encyc.html
Nakamura, K. (2012, February 16). Cosmic Rays [PDF]. Berkeley: Particle Data Group.
Nave, R. (2016, November 9). Energetics of Charged Pion Decay. Retrieved from: http://hyperphysics.phy-astr.gsu.edu/hbase/Particles/piondec.html
National University of La Plata Physics Department. (2015, May 6). Muon Basics. Retrieved from: http://www2.fisica.unlp.edu.ar/~veiga/experiments.html
NOAA. (2017, February 9). GOES Electron Flux. Retrieved from: http://www.swpc.noaa.gov/products/goes-electron-flux
SpaceWeather. (2008, May 4). The Interplanetary Magnetic Field. Retrieved from: http://www.spaceweather.com/glossary/imf.html